Bitcoin [BTC] traders, before you become exit liquidity, read this

Holders of the largest cryptocurrency, Bitcoin [BTC], might have a cause to be joyous in the coming days, blockchain analytics platform, Santiment, recently found.
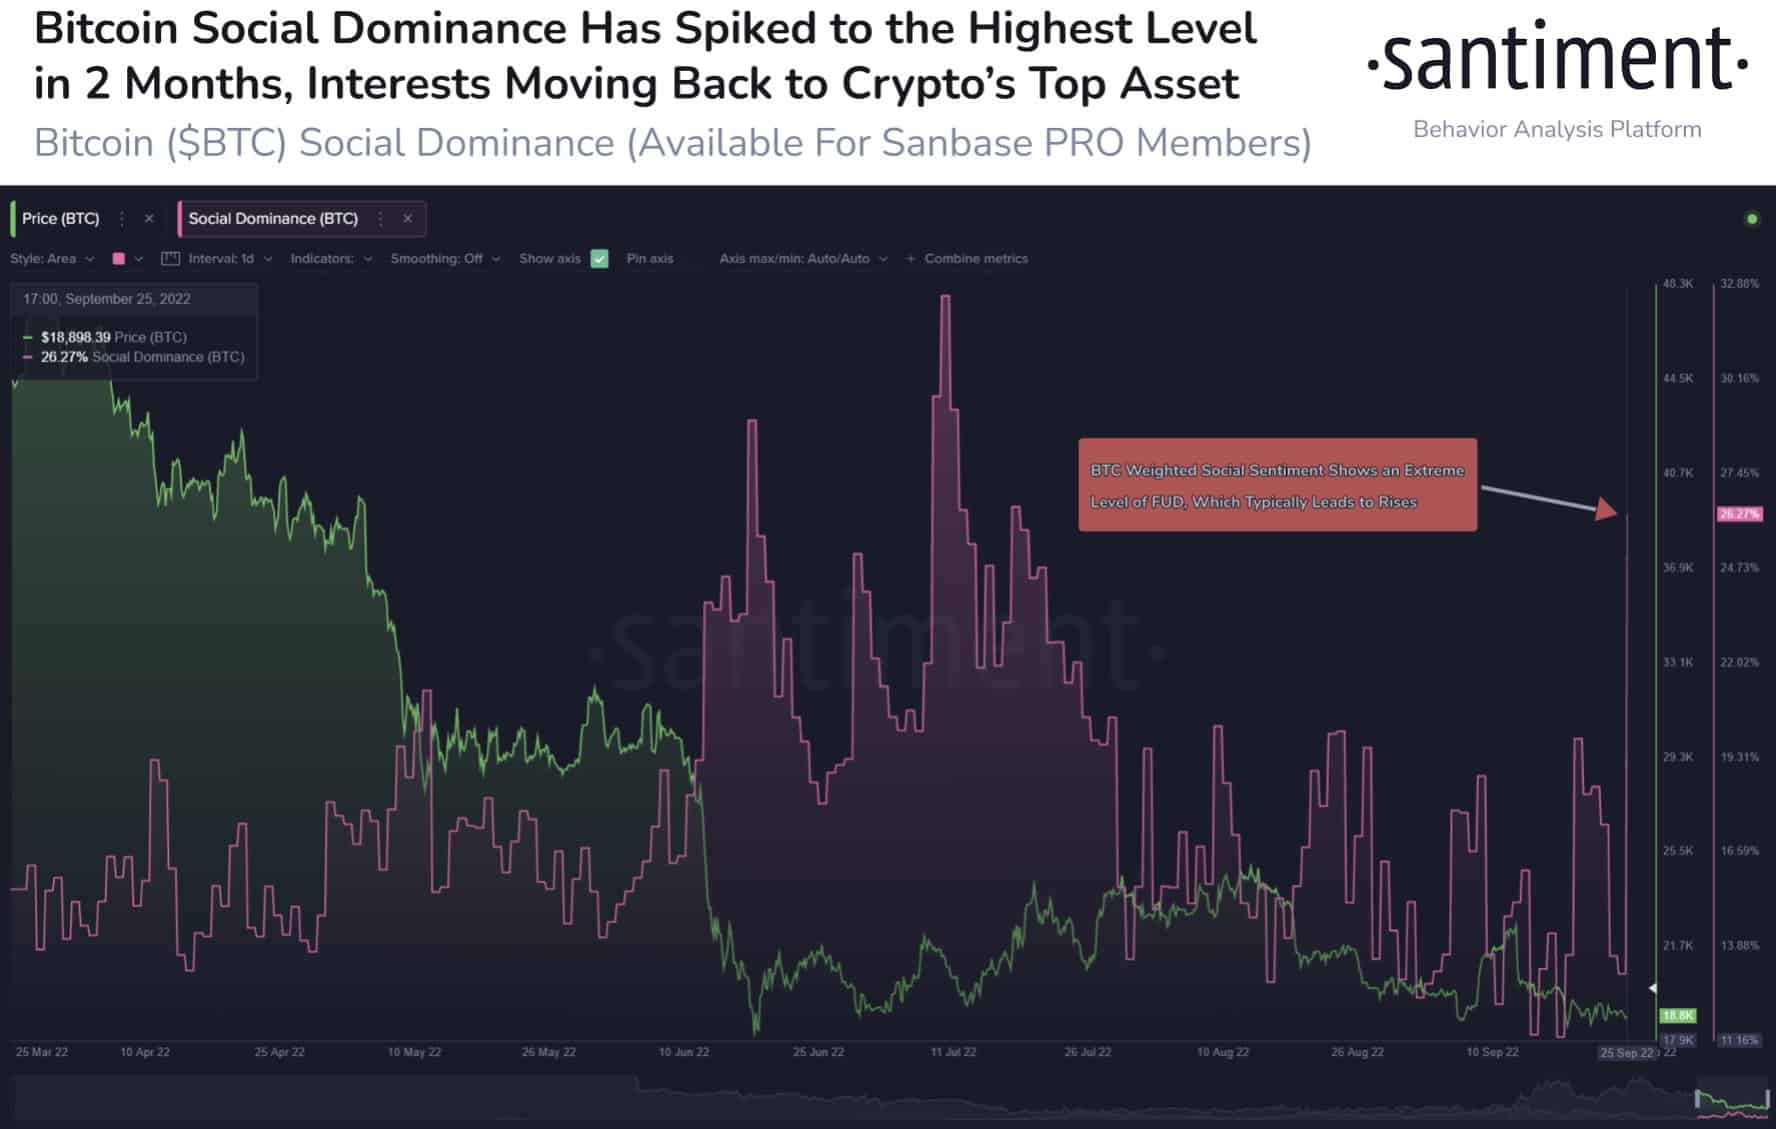
According to it, the just concluded trading session last weekend was marked by a surge in interest in BTC on multiple social platforms.
Santiment noted further that amongst the top 100 cryptocurrency assets, BTC was in over 26% of discussions for the first time since the middle of July.
It added that this rise in the king coin’s weighted social sentiment over the last weekend was an indication that an extreme level of FUD lingered in the BTC market. According to the analytics platform, this usually precipitates a spike in the price of an asset.
Not so fast
While the correlation between a rise in the social activity of a cryptocurrency asset and a corresponding growth in its price cannot be understated, BTC’s movement on the price charts suggested that the recent rally in the asset’s social activity should not be taken as conclusive proof of an imminent rise in the price.
Firstly, as per data from CoinMarketCap, BTC exchanged hands at $18,763.01, having declined by 1.40% in the past 24 hours. Trading volume was, however, up by 14.18% within the same period leading to a case of “Down Volume.”
Down Volume exists when the price of an asset drops and its trading volume surges within the same period. This is usually indicative of bearish trading. Hence, BTC sellers had been on a rampage in the past 24 hours.
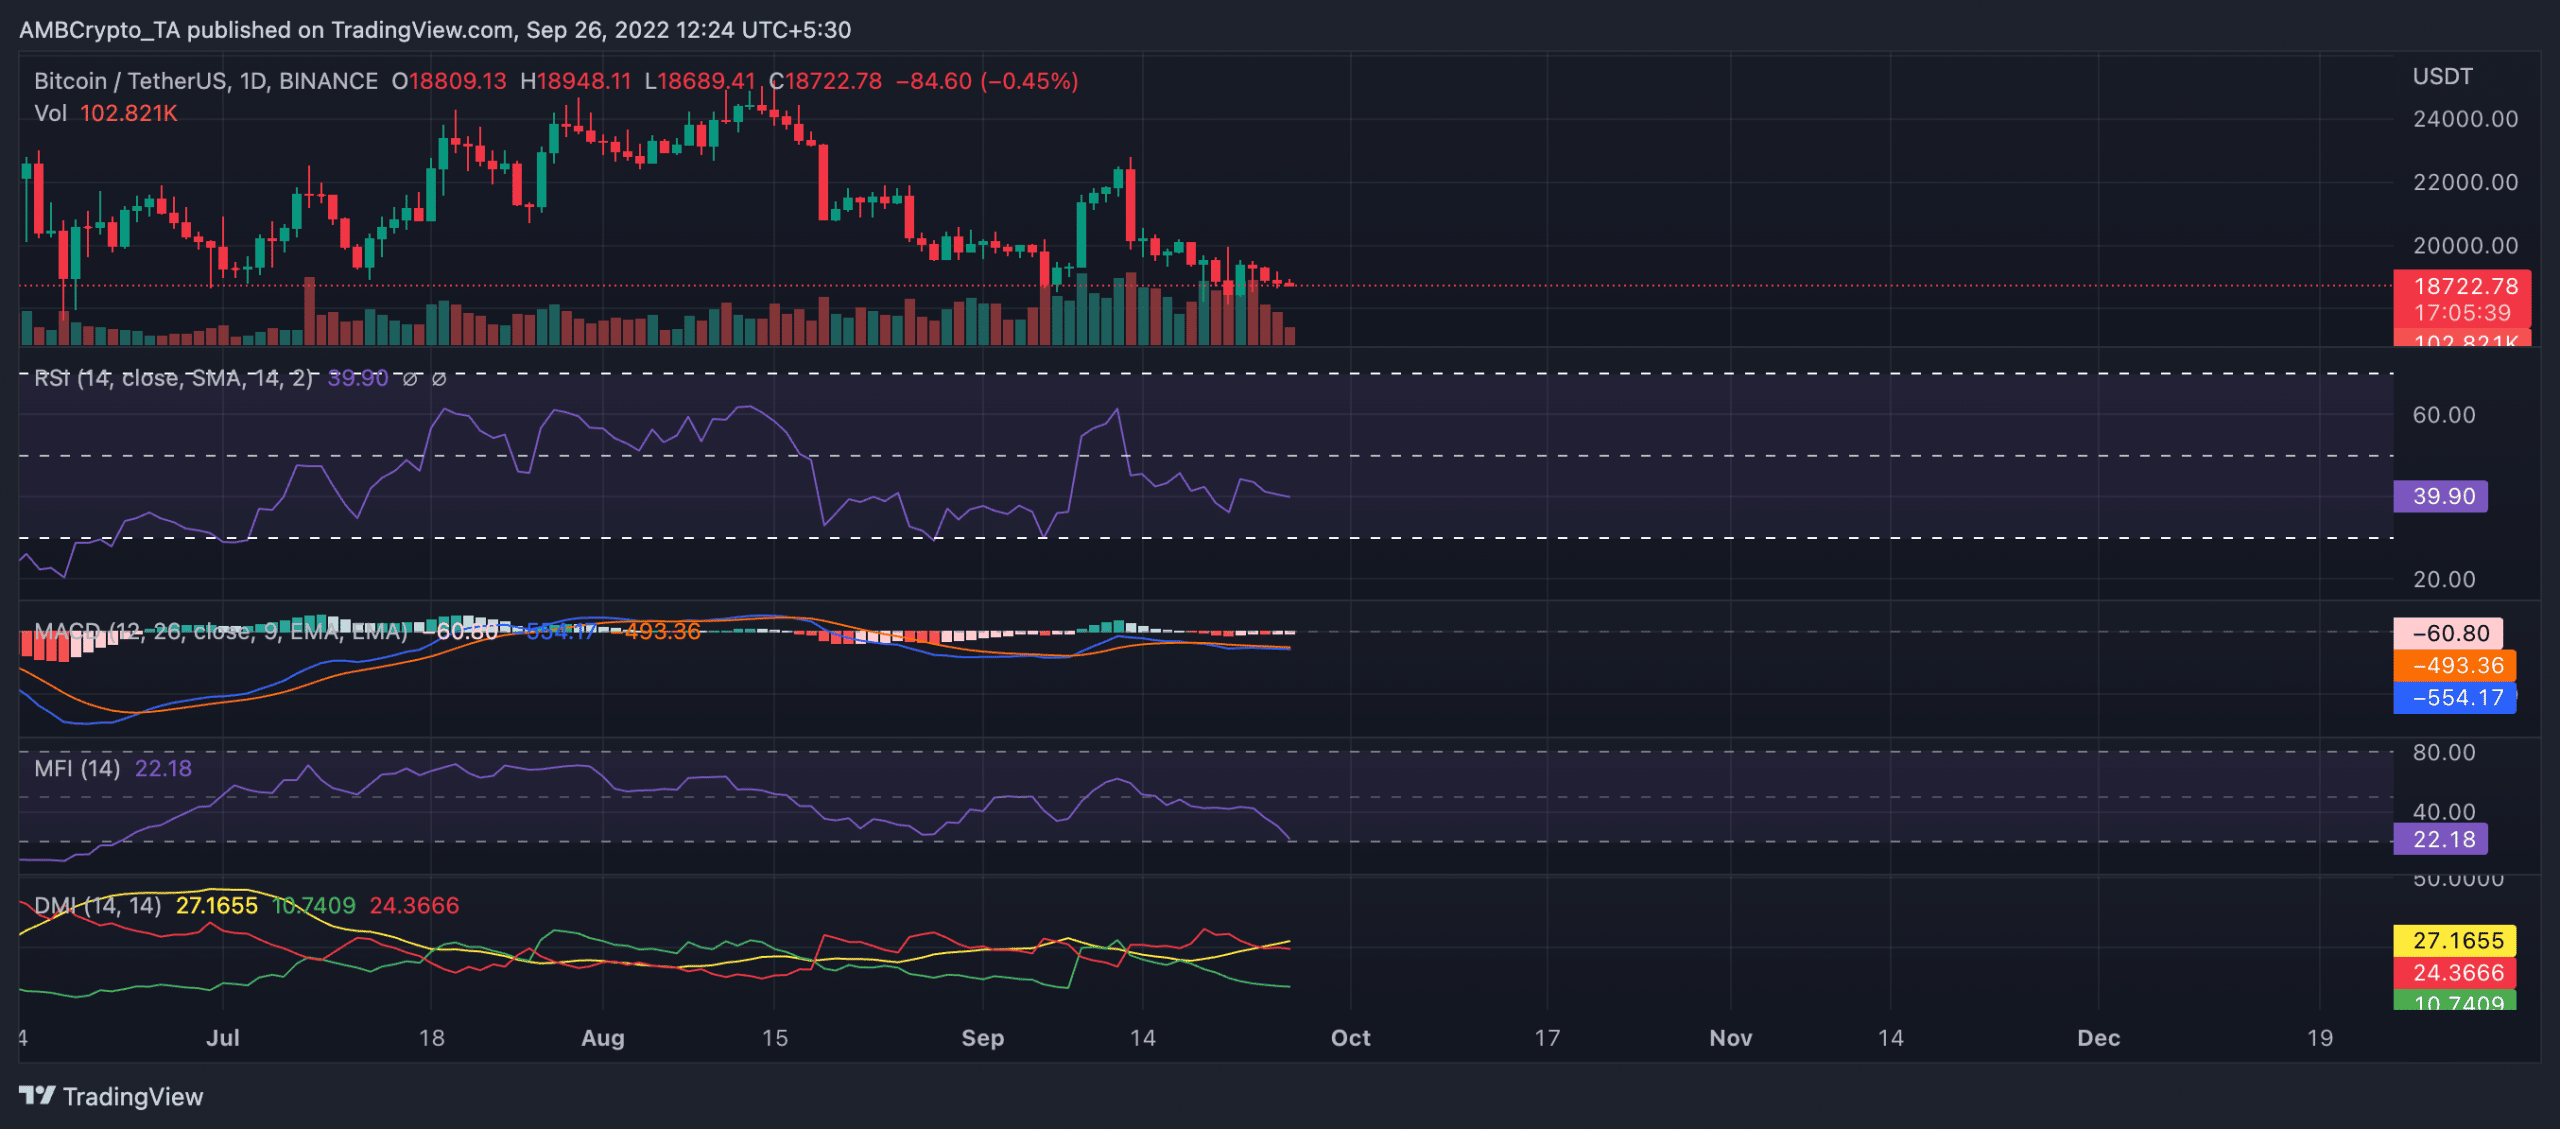
BTC on a daily chart
A look at the coin’s movement on the daily chart confirmed this position. At press time, the asset’s Money Flow Index (MFI) inched closer to the oversold position at 22.18. In fact, BTC’s MFI had dropped consistently since it breached the 50-neutral line on 15 September.
The Relative Strength Index (RSI), also on a freefall since 13 September, was at 39.90 as of this writing. The consistent fall in these key indicators only hints at one thing – waning buying pressure.
Furthermore, the position of the Moving average convergence divergence (MACD) at press time lent more credence to the view that sellers had control of the BTC market.
Represented by red histogram bars (albeit short), there was a downward intersection between the MACD line and the trend line on 18 September, which indicated the commencement of a new bear cycle.
Lastly, BTC’s Directional Movement Index (DMI) showed that sellers controlled the BTC market on a daily chart.
At press time, the sellers’ strength (red) at 24.36 was solidly above the buyers’ (green) at 10.74. It has been this way since 14 September.