As Shiba Inu bounces from long-term support, here’s what can happen next

Disclaimer: The findings of the following analysis are the sole opinions of the writer and should not be considered investment advice.
Shiba Inu appeared to form a triangle pattern and has bounced weakly from the $0.00002045 support level in the past few months. At the time of writing, another level of support at $0.00002392 appears to have been flipped to resistance. The selling pressure has been heavy in recent weeks.
SHIB- 3 Day Chart
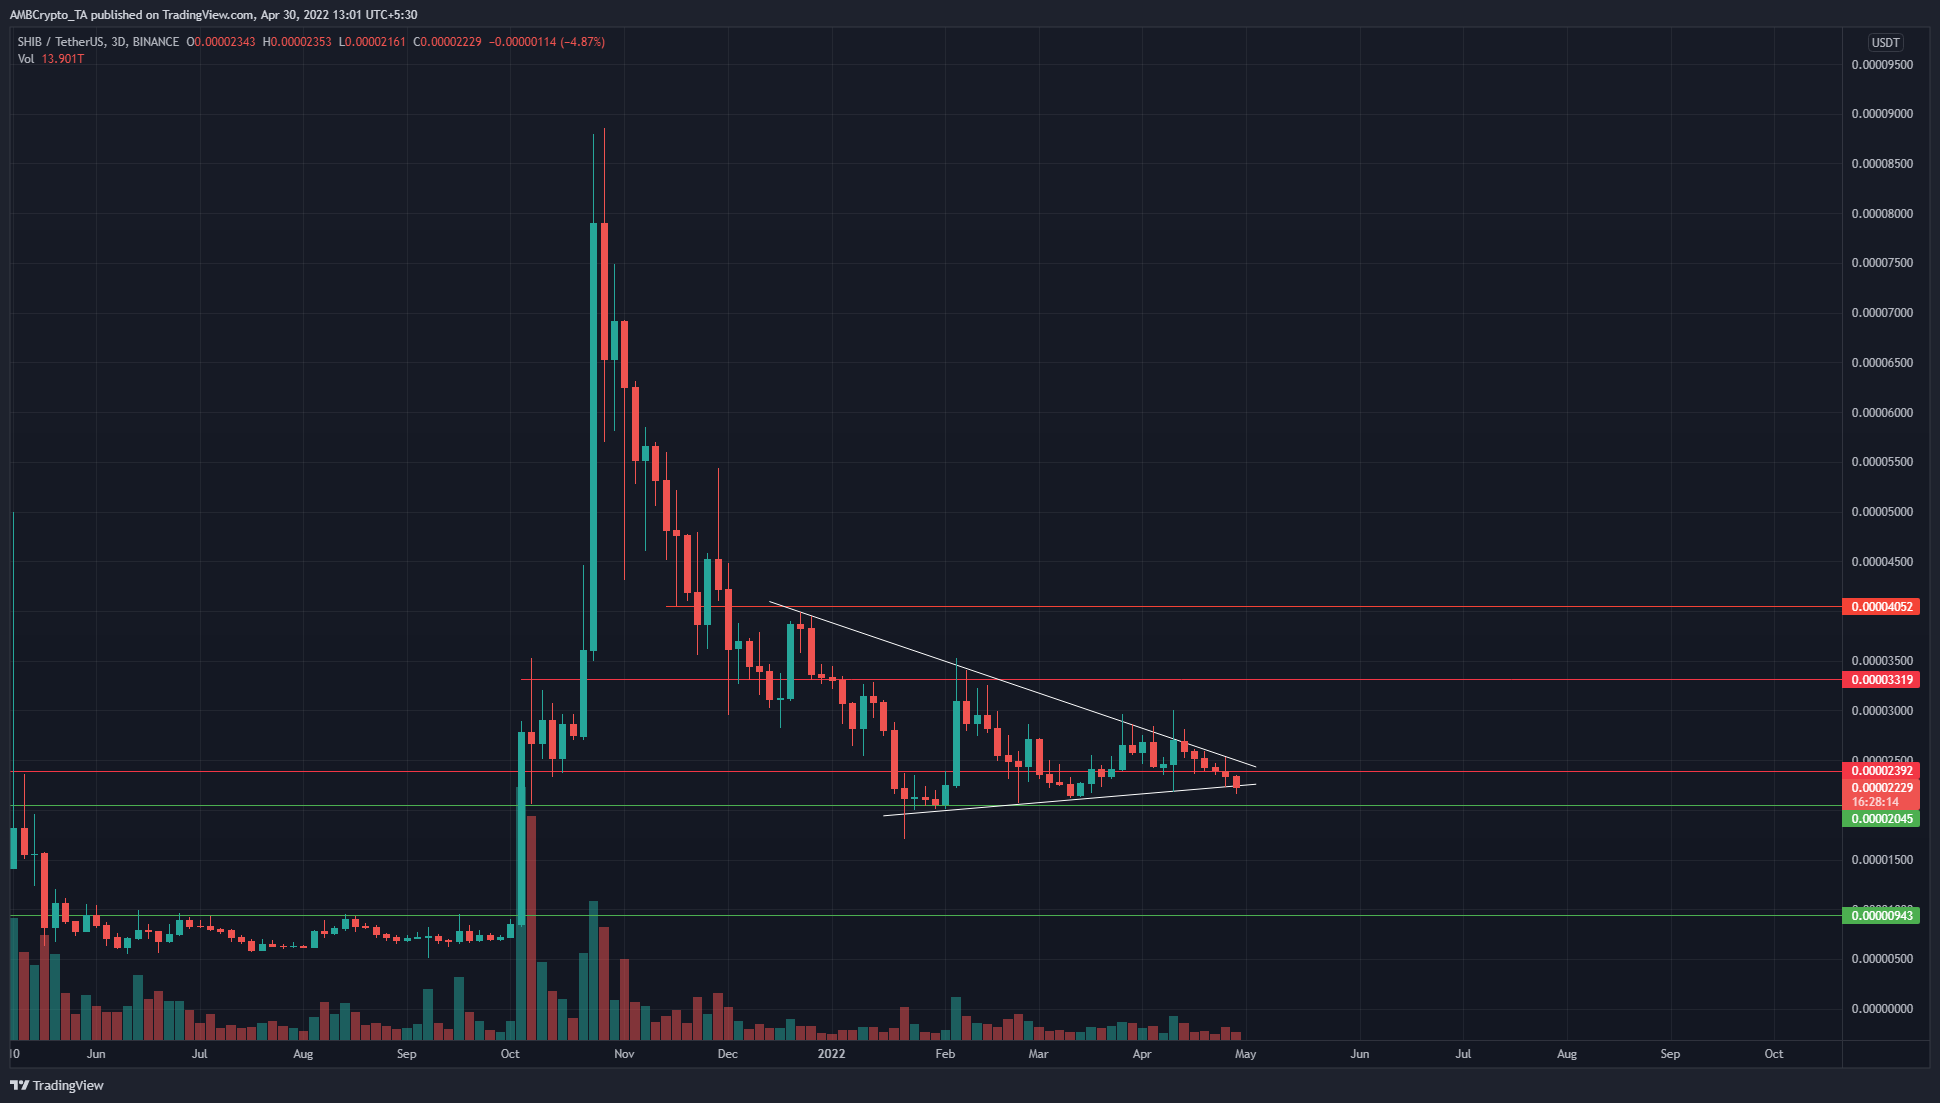
The price action tells a tale of strong bearish pressure since late November. The market structure has been bearish since the price slipped beneath $0.0006 and $0.000055, as SHIB made a series of lower highs and lower lows.
However, this has seen a change in the past two months. SHIB has formed higher lows in the year 2022 after it dropped to $0.000017 in January.
Taken together, the past couple of months have seen SHIB form lower highs but also higher lows, resulting in the triangle pattern. This is indicative of compression for SHIB before its next strong move.
Rationale
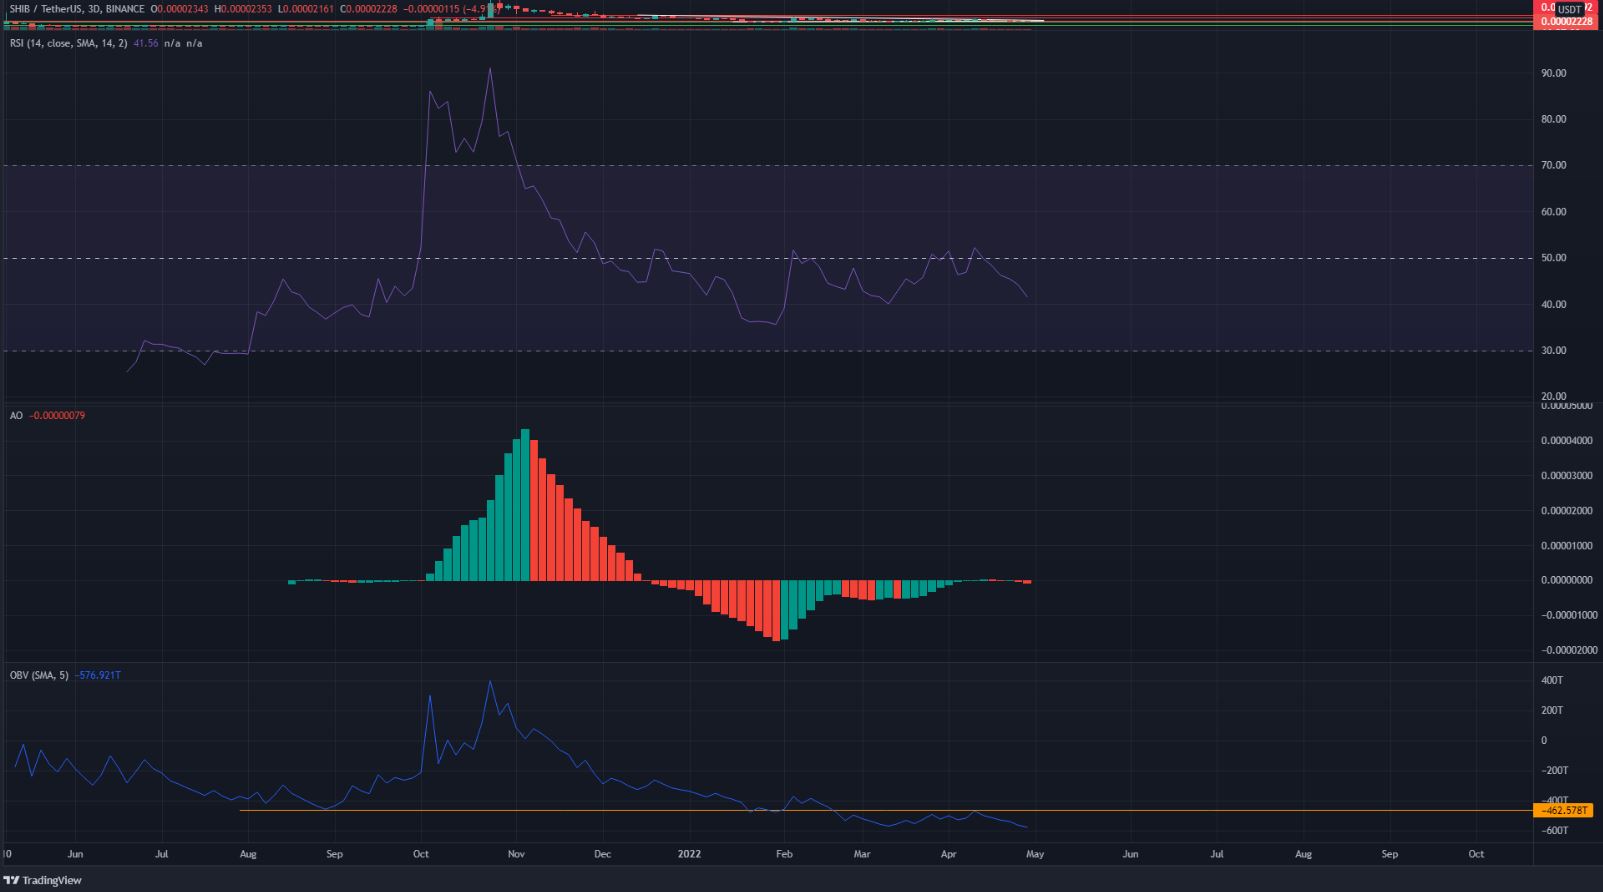
What could the direction of this next move be? According to the RSI, downward. The RSI on the 3-day chart has not managed to climb above neutral 50 since November. Recently, the same neutral 50 has rejected the RSI’s attempt to climb higher, which meant that the downtrend was still in sway.
Similarly, the AO has also been unable to climb past the zero line to suggest a shift in momentum in favor of the bulls. On the OBV, a level that had acted as support in the past has been flipped to resistance in mid-April.
Therefore, the buyers’ attempts to reverse the trend have been strongly rejected, and a renewed downtrend could be expected upon the close of a 3-day session below the lower trendline.
Conclusion
While the price did form higher lows in the past three months, there was not enough evidence to suggest that the market structure had flipped toward a bullish bias.
Moreover, the momentum and volume indicators highlighted the strong bearishness behind Shiba Inu. Selling volume has far outweighed buying volume in recent weeks. Hence, Shiba Inu is likely to face further losses on the price charts in the weeks to come.


