Assessing Cardano’s potential to inflict a breakout from this pattern

Disclaimer: The findings of the following analysis are the sole opinions of the writer and should not be considered investment advice.
After an expected up-channel breakdown, Cardano [ADA] spurred bearish pressure that pulled the coin toward the $0.43 baseline. The previous month’s bear run found rebounding grounds from this baseline as the altcoin chalked out a reversal pattern over the last few weeks.
The bears could now aim to constrict the bullish volatile break as the price action the upper boundary of the reversal pattern. At press time, ADA was trading at $0.516, up by 1.03% in the last 24 hours.
ADA Daily Chart
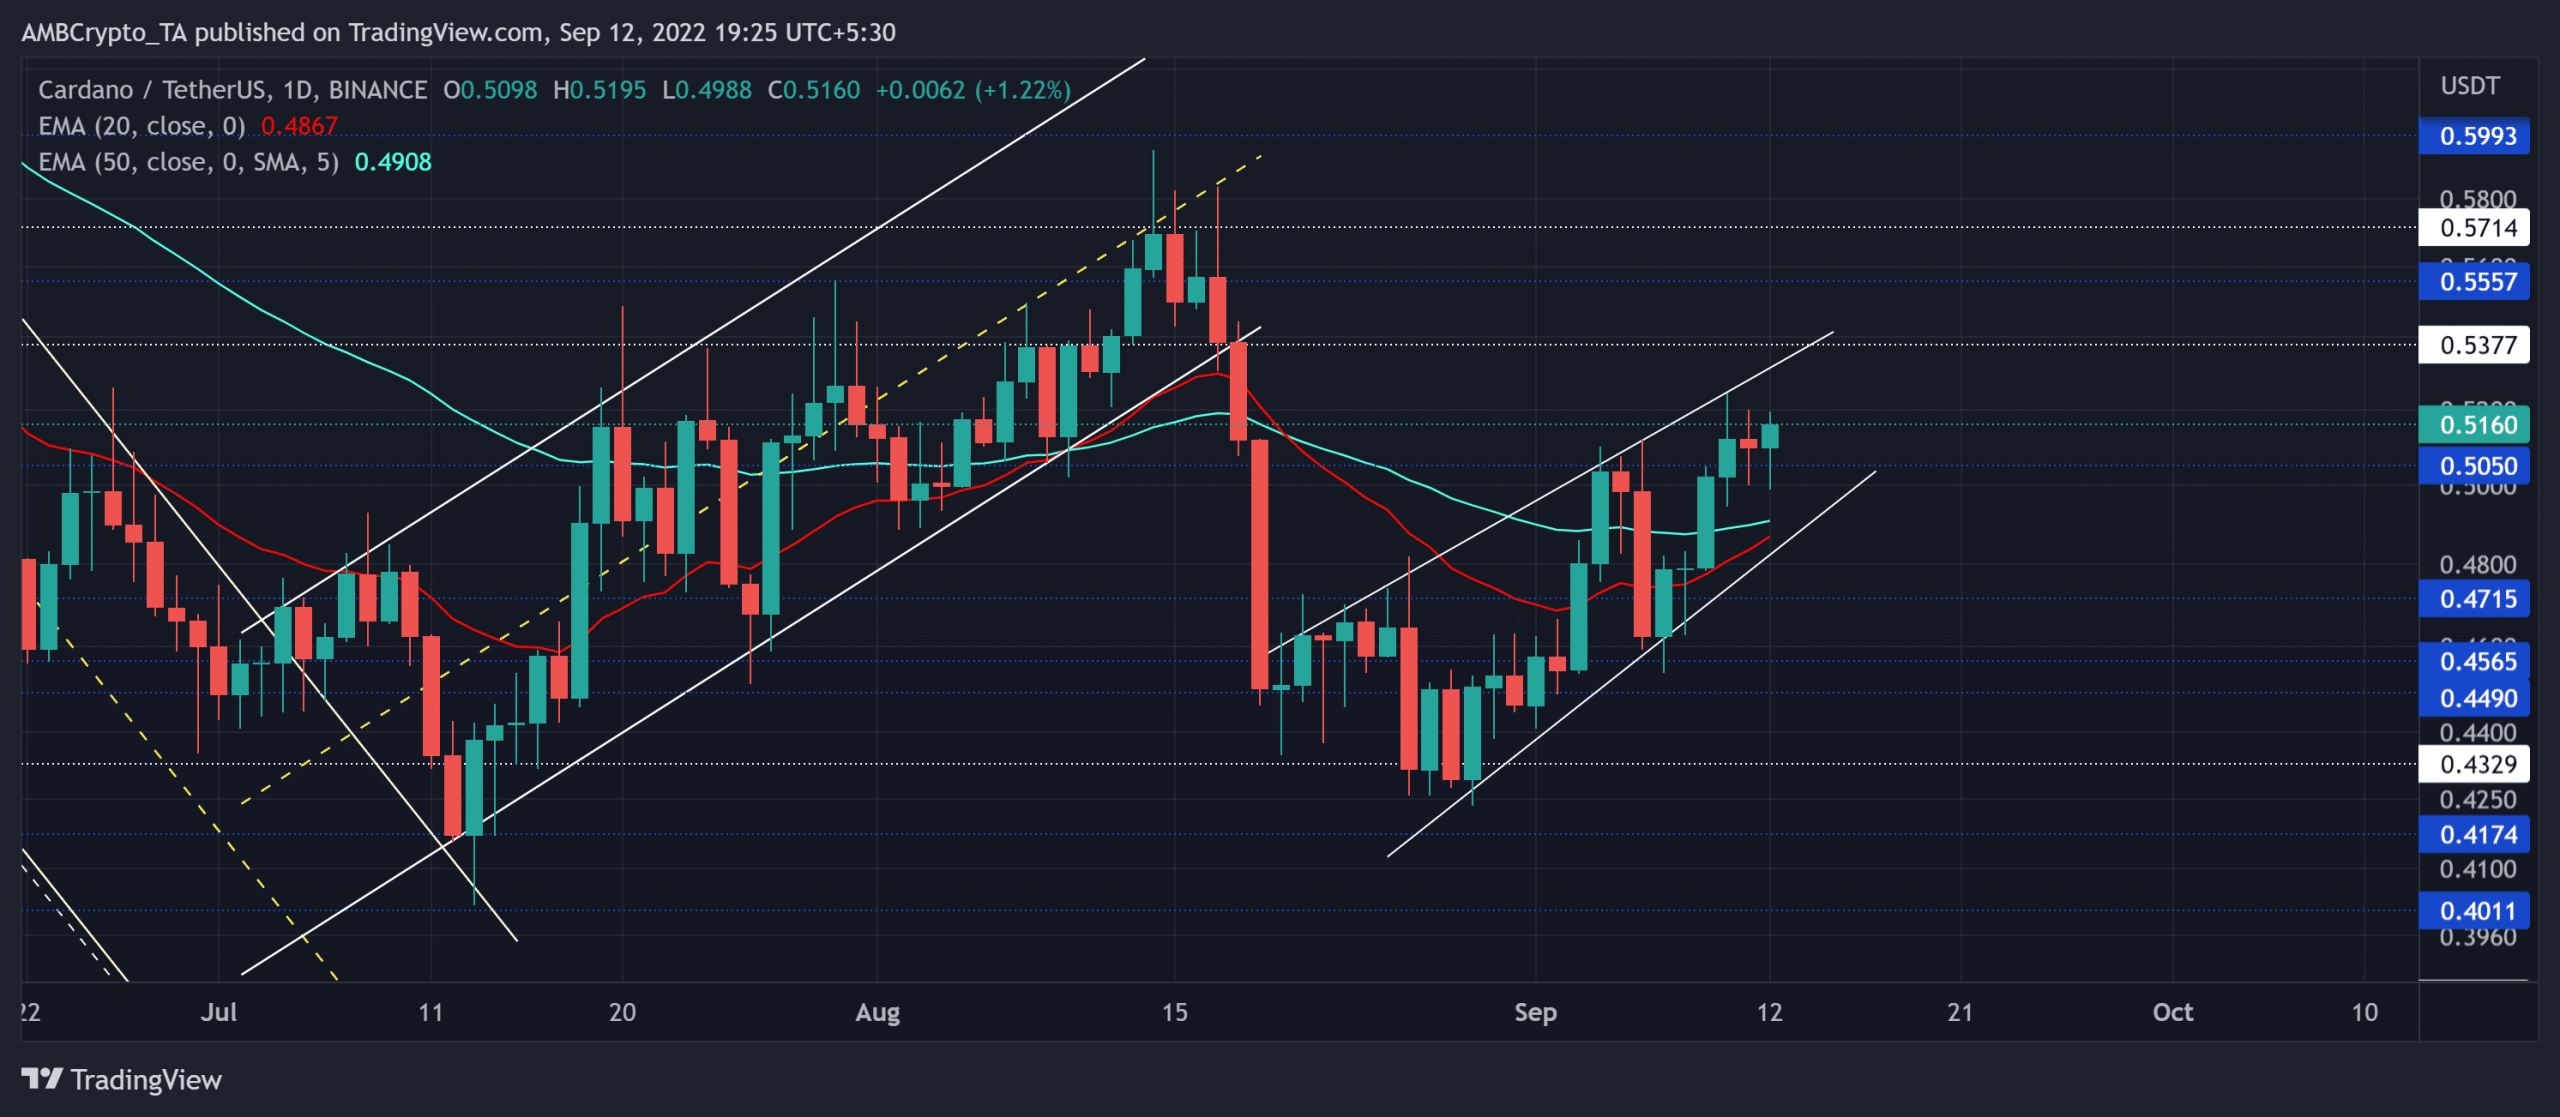
The previous pattern’s breakdown transposed into a relatively robust rising wedge recovery on the daily chart. Meanwhile, the price action found a close above the chains of the 20 EMA (red) and the 50 EMA (cyan) to depict an increased buying edge.
The resultant growth has brought ADA into a high liquidity zone in the $0.5-$0.53 range. Continued progress from the current levels could see hurdles in the $0.53-zone. Also, the recent volumes have depicted a downtrend. This reading entailed a slightly weak bullish move.
A potential reversal from the $0.53-level could induce a squeeze phase in the coming sessions. Any decline below the $0.5-mark and eventually the pattern would hint at a sell signal. In these circumstances, the potential target would lie in the $0.47-$0.49 range.
However, a bullish crossover on the 20/50 EMA could extend the ongoing growth toward the $0.55-$0.57 range before a plausible reversal.
Rationale
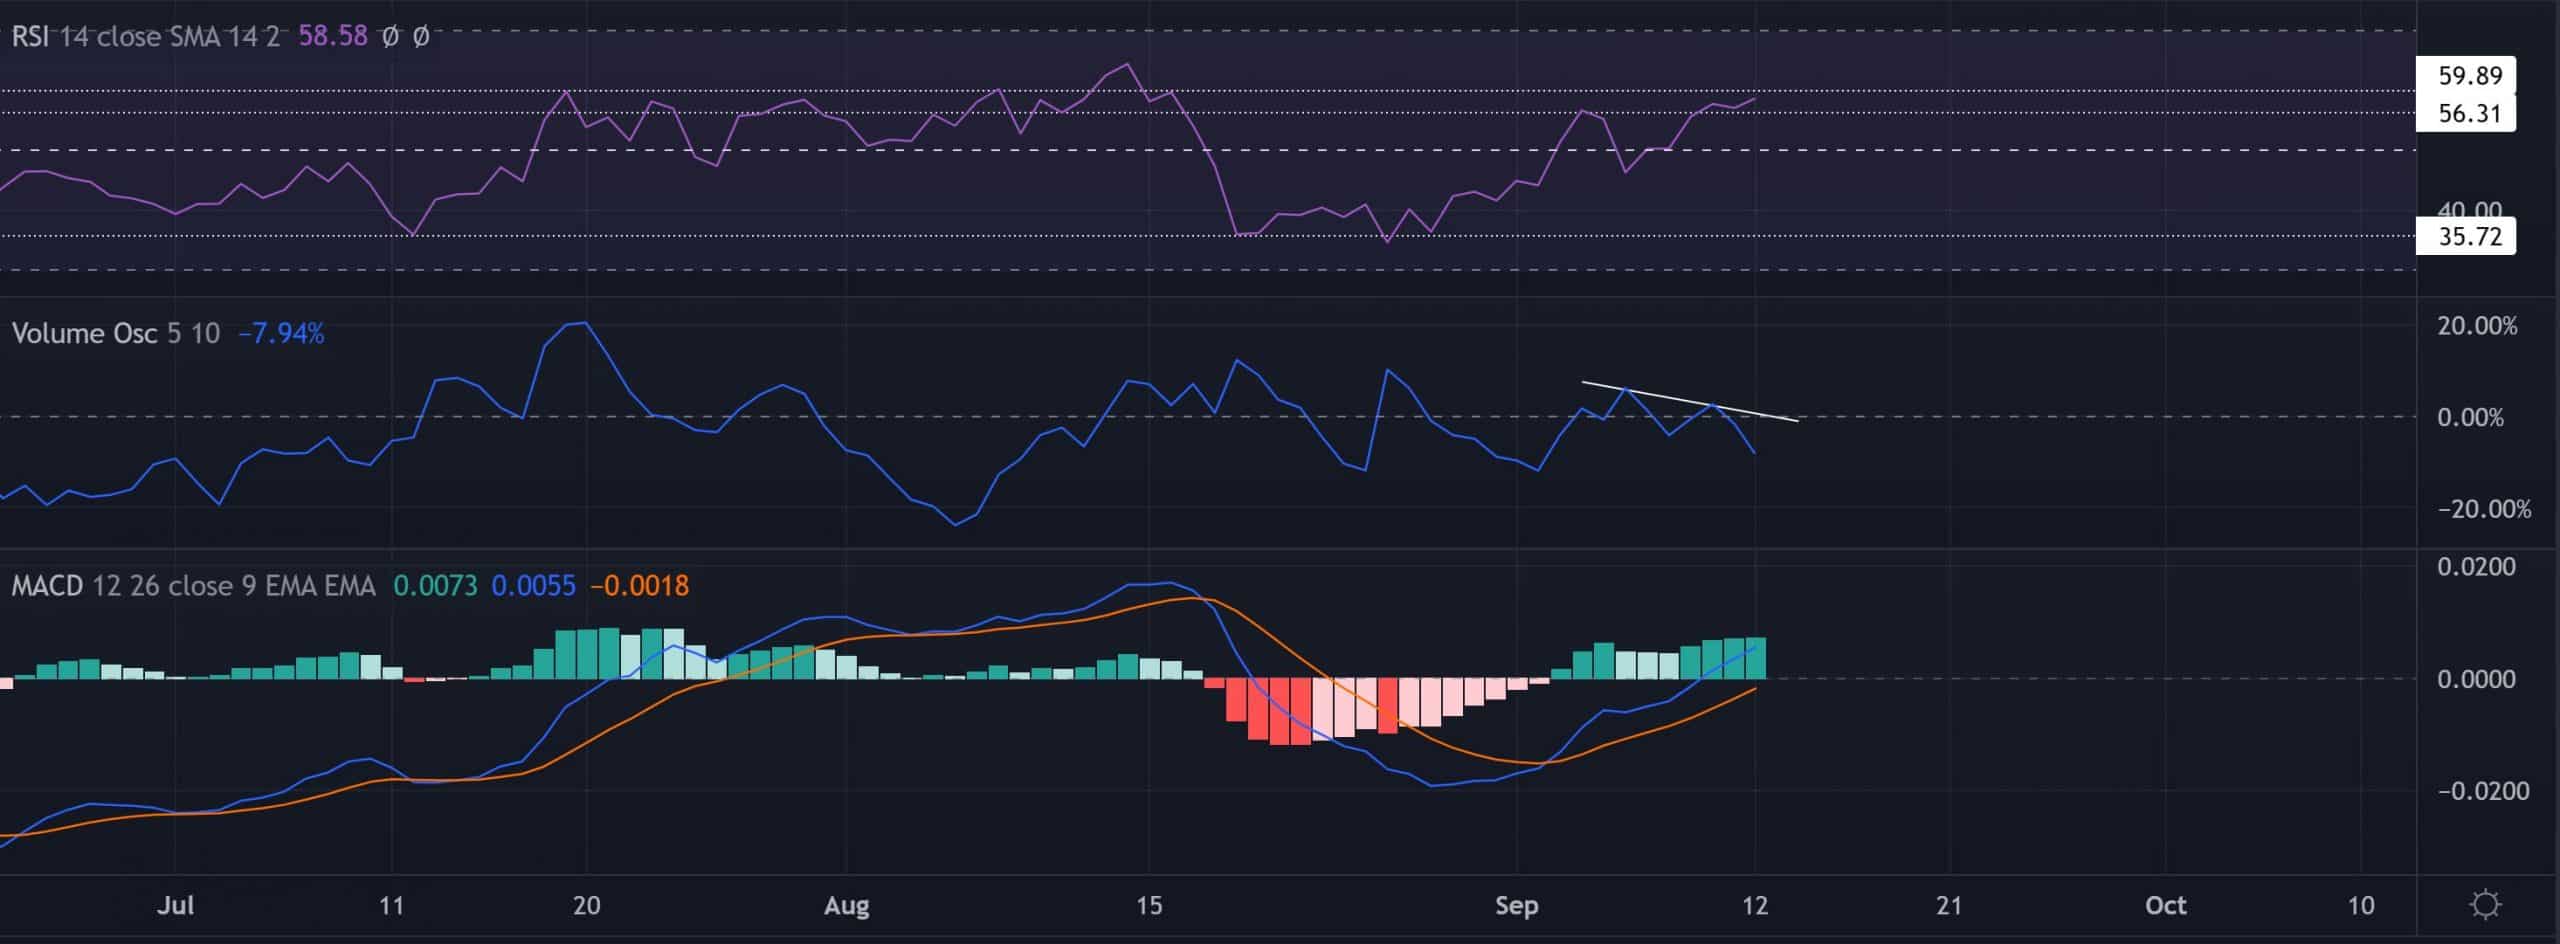
The Relative Strength Index (RSI) took a bullish stance while finding resistance in the 56-59 range. A close below this range could heighten the chances of a sluggish phase on the chart.
The Volume Oscillator (VO) witnessed lower peaks over the last few days. his trajectory bearishly diverged with the price action’s recent gains. Nonetheless, the MACD lines are moving north. A comfortable position above the zero mark would be favorable for the buyers.
Conclusion
Given these mixed indications, ADA walked on eggshells. A reversal from the $0.53-reisstance can confirm the slow-moving/bearish bias. A close above this level can invalidate the near-term selling inclinations. In either case, the potential targets would remain the same as above.
Finally, traders/investors should keep a close watch on Bitcoin’s movement and its effects on the wider market to make a profitable move.


