Assessing if Bitcoin Cash [BCH] will see a period of accumulation soon

Disclaimer: The findings of the following analysis are the sole opinions of the writer and should not be considered investment advice.
Bitcoin Cash has a strong positive correlation to Bitcoin, in terms of price movement. The 30-day price correlation stands at +0.96, which means that BCH has been following the trend of Bitcoin in the past month.
Bitcoin appears primed for a push toward the $34.4k and $36k resistance areas, and this could propel Bitcoin Cash higher on the price charts as well. However, the longer-term trend remained bearish, and BCH could face strong sellers at $217 and $240.
BCH- 1 Day Chart
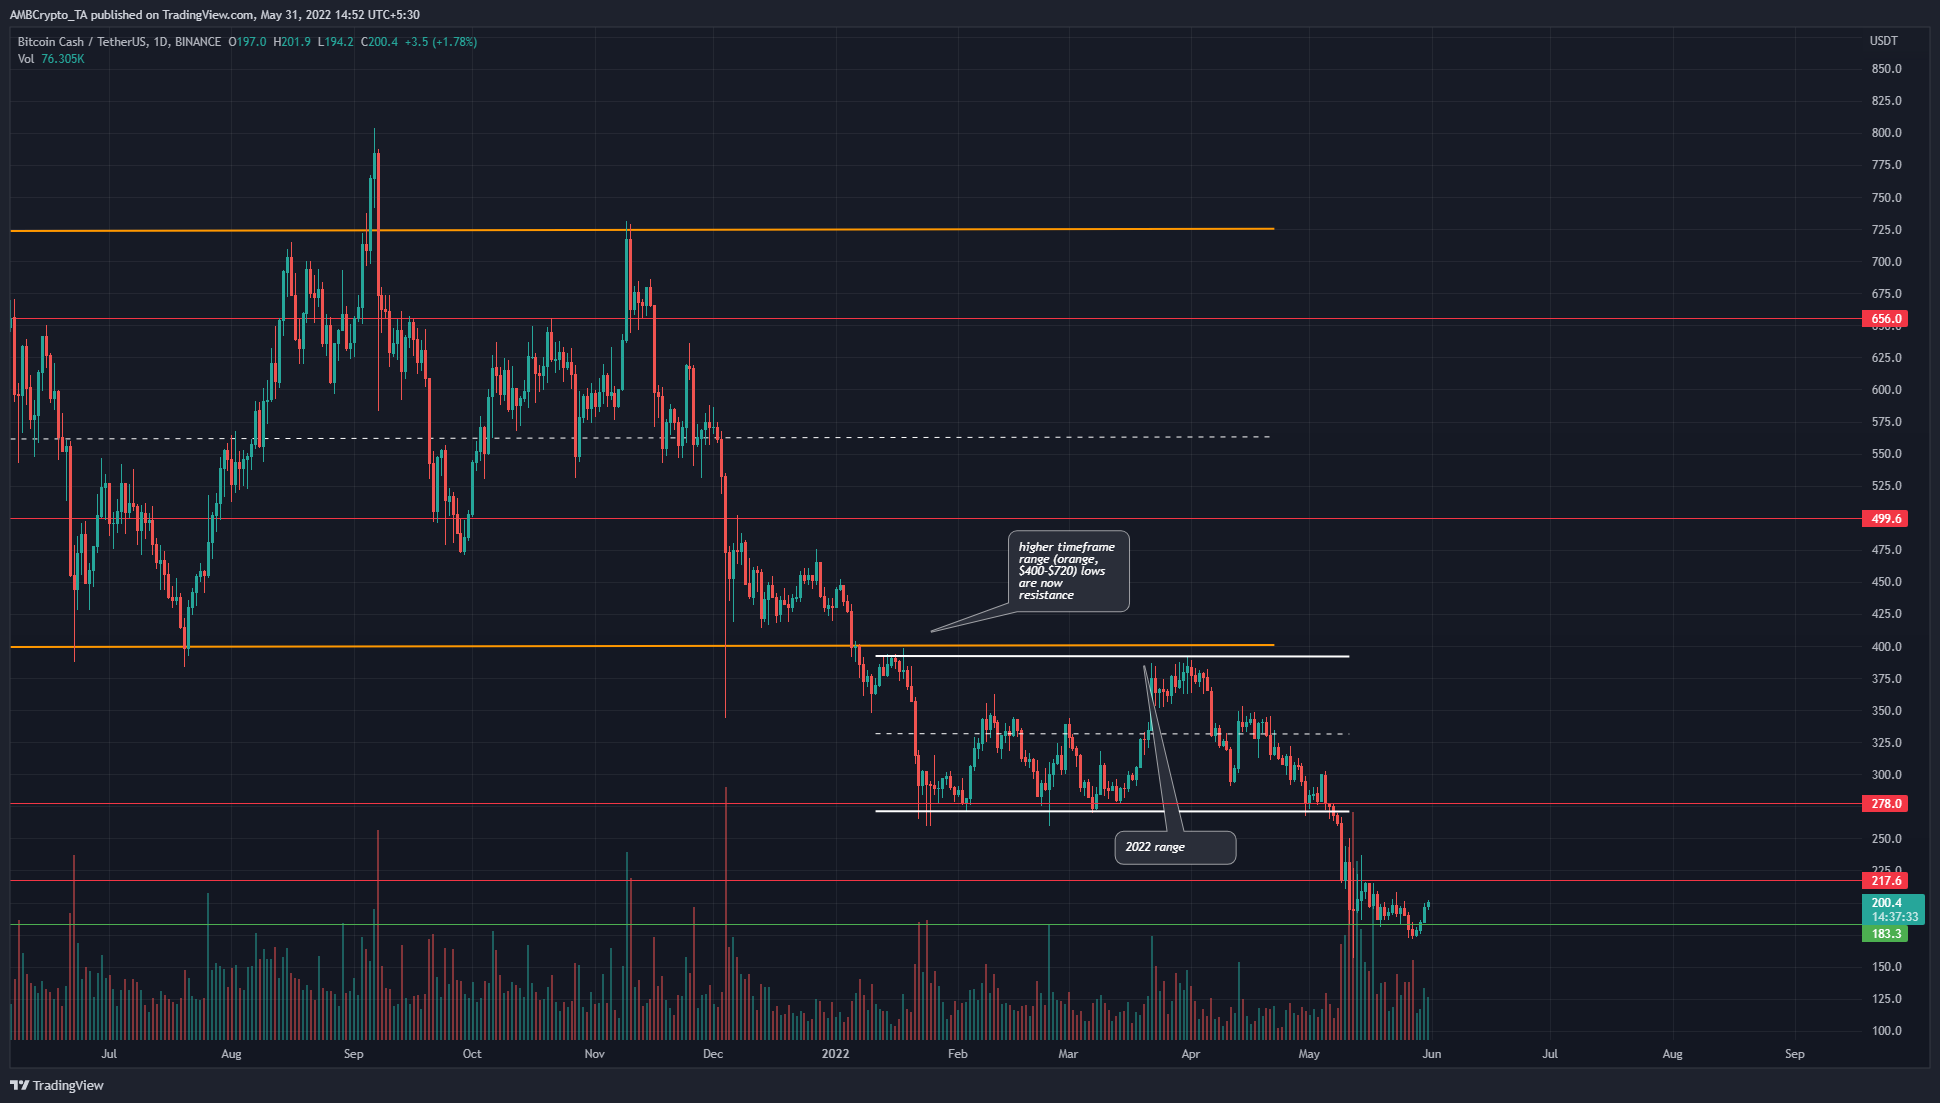
Bitcoin Cash had traded within a range from $277 to $380 in 2022, until early May, when the price plummeted to the $180 mark. This was an ugly development for the bulls because the $278 support was a long-term horizontal level of significance. However, the price just crashed past it in late April/early May.
Technically, the market structure is strongly bearish as evidenced by BCH forming a series of lower highs and lower lows since November on the D1 chart. For the longer-term bias to flip to bullish, the price has to push past the $27-$300 area of resistance and flip it to support.
On the way up there, the $217 and $242 levels can also pose stiff resistance. Ultimately, Bitcoin’s own trend can force BCH higher, although a market structure shift might not take place.
Rationale
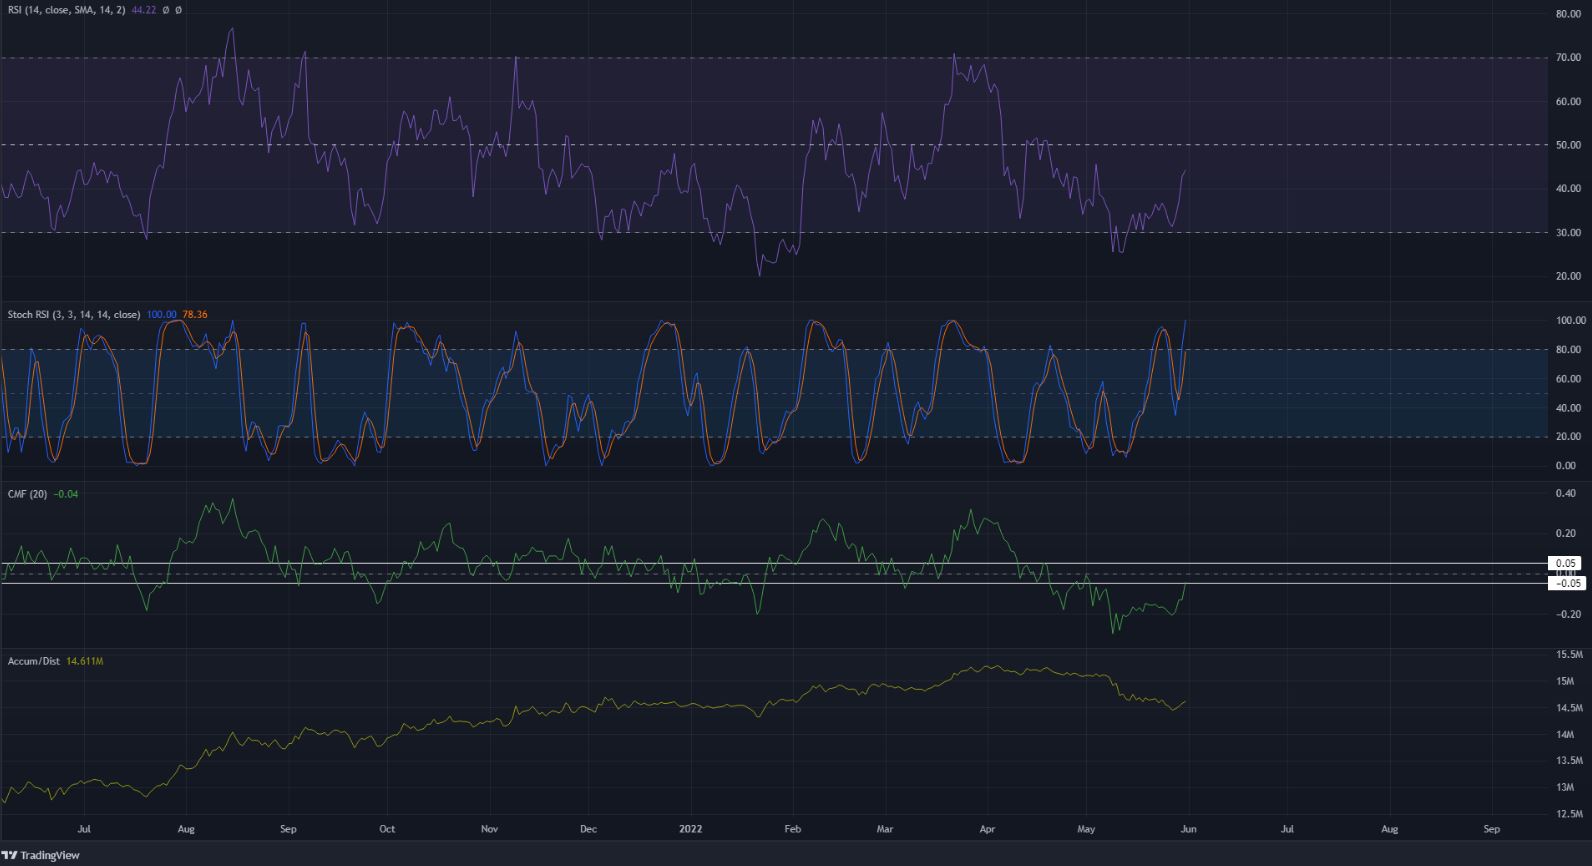
The RSI has been below neutral 50 since early April, to indicate that the momentum was in favor of the sellers. This was when the price was near the 2022 range highs, and the price has been slipping lower since. The Stochastic RSI was also in the overbought territory.
The CMF has been beneath -0.05 since April, but at press time was on the verge of climbing back above it to show that the selling pressure had subsided. In May 2022, the A/D took a sharp dive, but it has been rising overall since August 2021.
Conclusion
The larger trend for BCH remained bearish, and the $217 and $240 levels can be areas where market participants can look to sell the asset. The presence of heavy resistances to the north, combined with the strong bearish structure, meant that longer-term investors would need to be patient for the bias to shift and a buying opportunity to present itself. The rising A/D does not by itself dictate a reversal in the trend towards the upside.