Assessing if Cardano bulls can initiate long-term rally in September

Disclaimer: The findings of the following analysis are the sole opinions of the writer and should not be considered investment advice.
Data on Coinglass showed that the majority of market participants were positioned short on the ADA-USDT pair over the past 24 hours.
Indeed, on the lower timeframes, Cardano had a bearish outlook after it slipped beneath the $0.45 level. In the next day or two, the $0.442 and $0.43 levels could be tested as support.
For traders and investors with a longer time horizon, the entire region from $0.44-$0.4 was worth watching. Bulls can expect a bounce from this zone, but the charts do not look encouraging. Enthusiastic bulls might be forced to shelve their fervor as September progresses.
ADA- 1-Day Chart
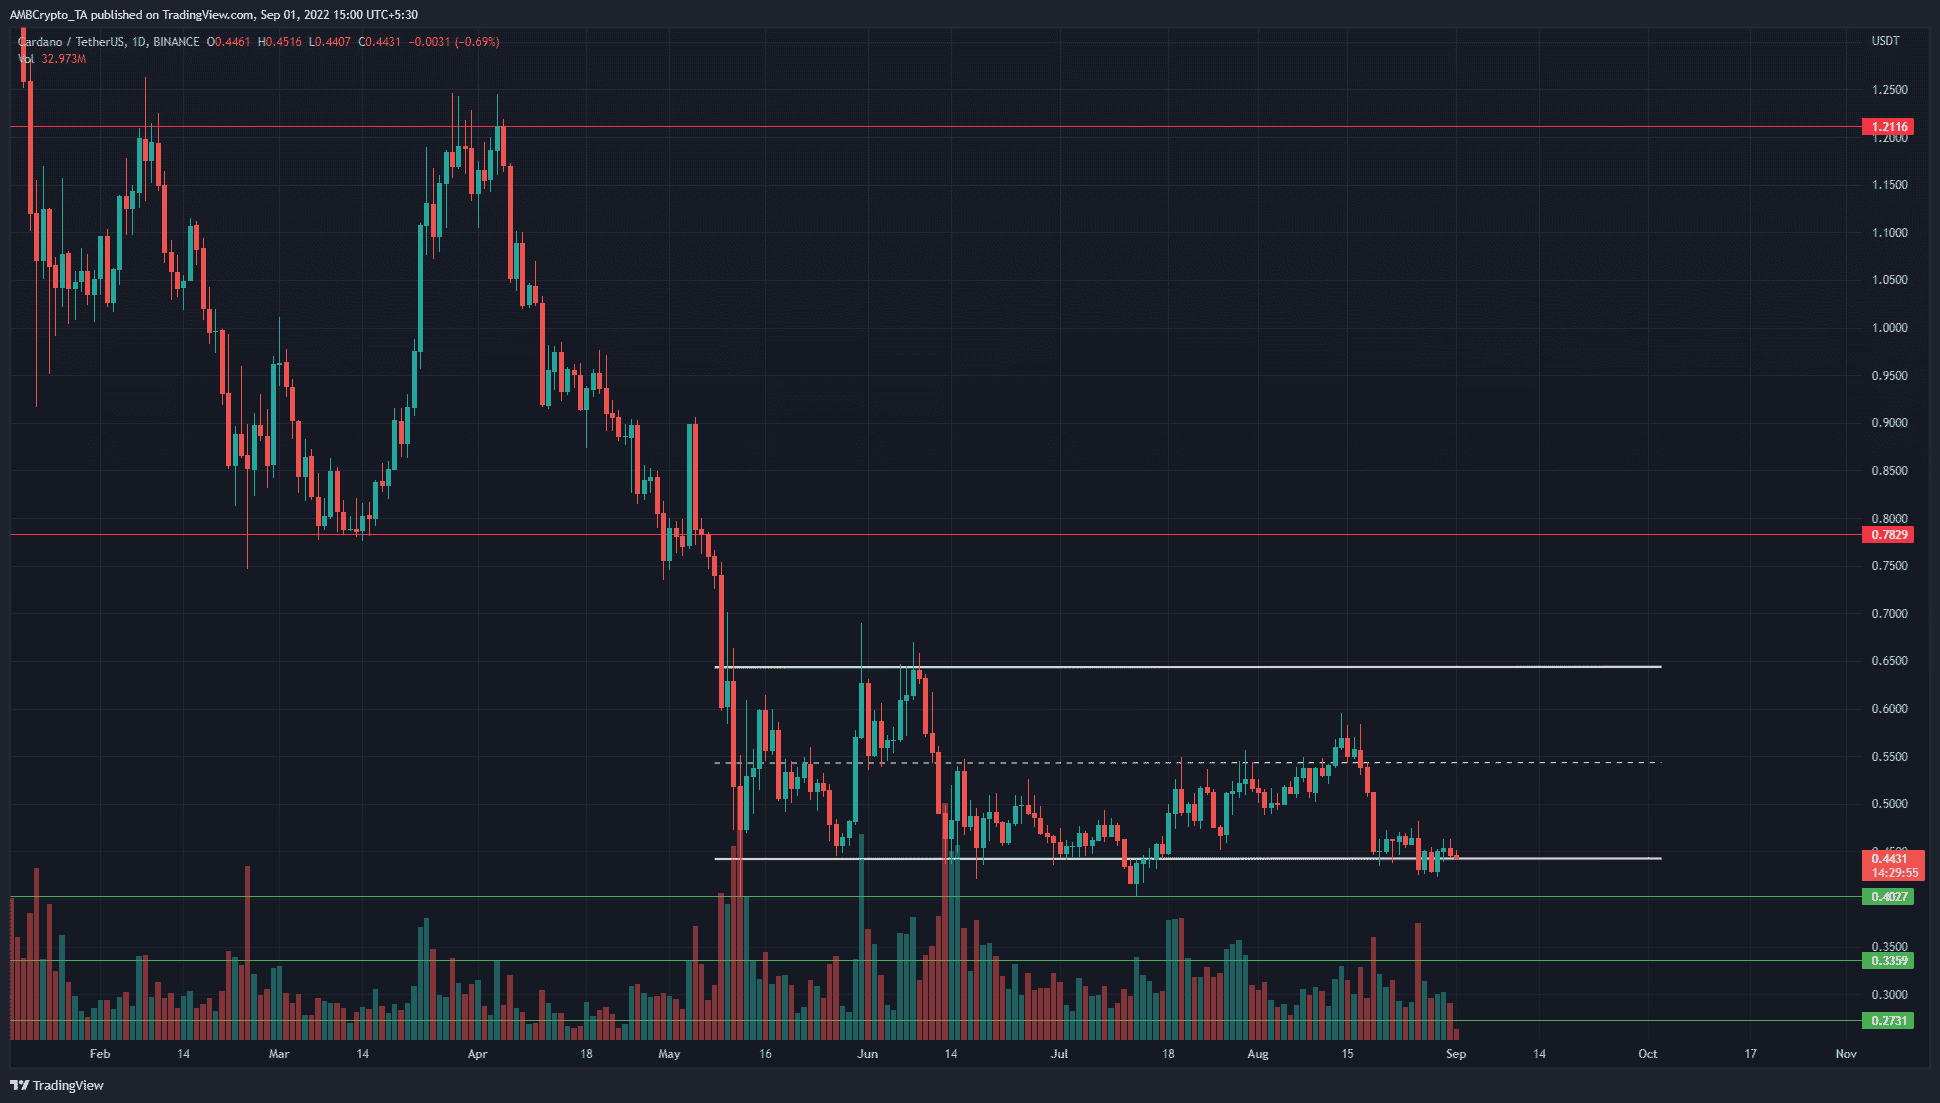
A range from $$0.644 to $0.442 was highlighted in white, with the mid-point at $0.543. Since May, the price has toiled within this range. In May and early June, plenty of volatility was seen as the price bounced from the lows to the highs. However, this volatility has quietened down in recent weeks.
A move past the mid-range materialized partway through August, but the bulls were unable to follow through on their threats of a push toward $0.65.
The $0.4 level acted as support in July and was a long-term support level that has been significant in January 2021 as well. Therefore, this level would be key in the weeks to come. A daily close below this level could see a sharp plunge.
Rationale
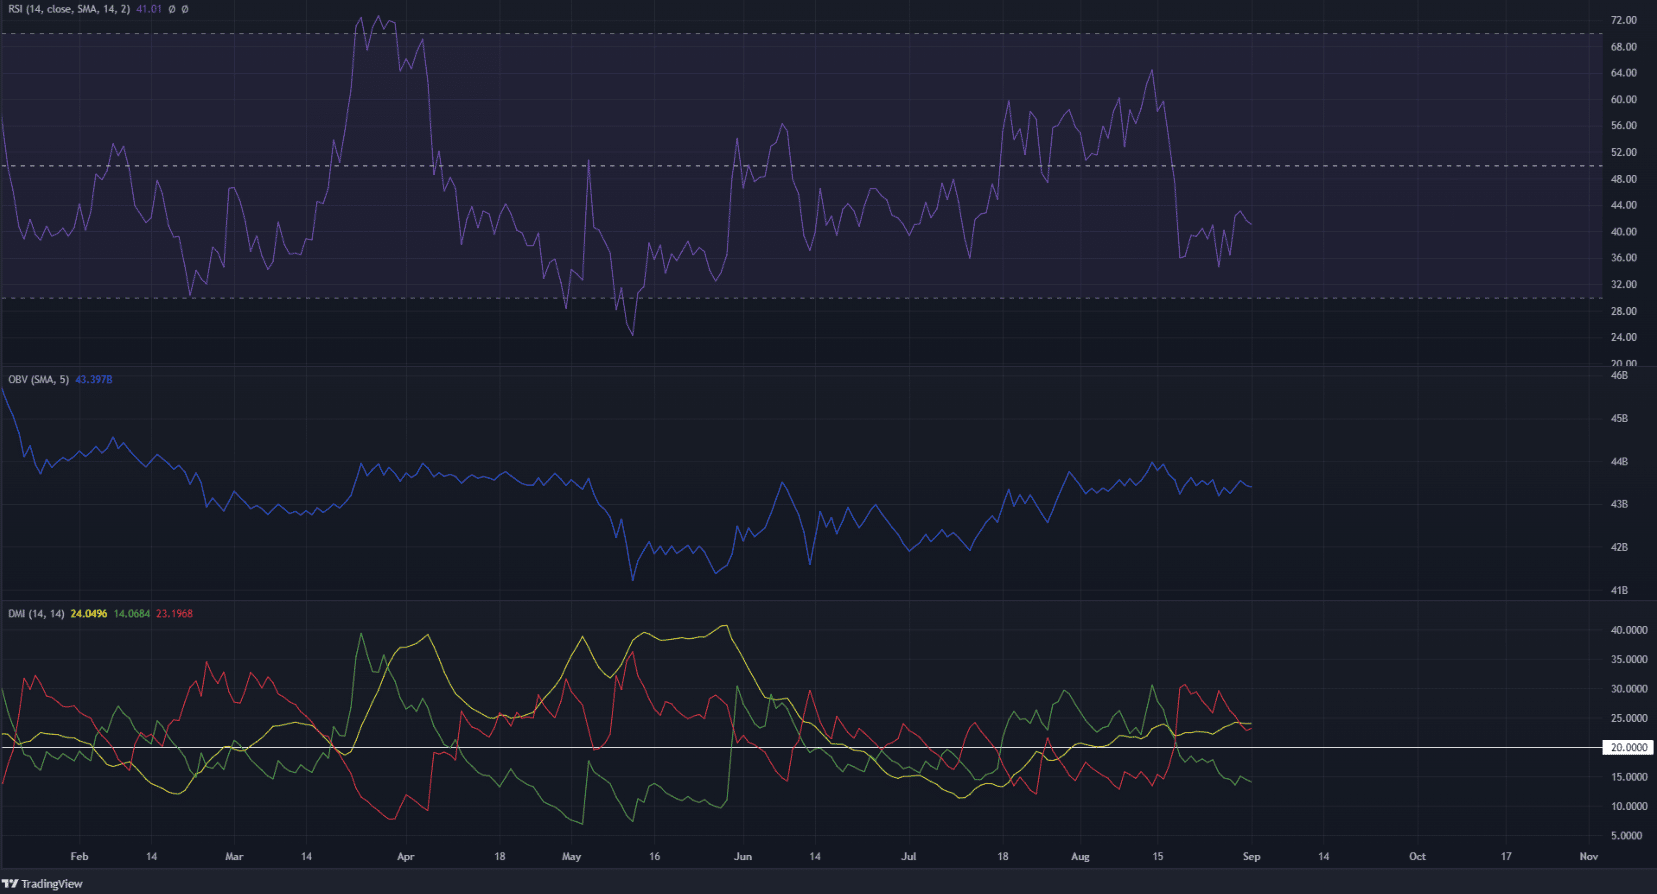
The daily Relative Strength Index (RSI) stood at 41. On the back of the sharp drop from $0.54 support, the RSI failed to hold on to the neutral 50 support in August. Nearly a month’s worth of gains was wiped within a week, and the momentum turned bearish as well.
The Directional Movement Index (DMI) also showed a strong downtrend, as both the Average Directional Movement Index (ADX) (yellow) and the -DI (red) were above the 20 mark.
Despite this grim development, the buyers seemed unfazed. The On-Balance Volume (OBV) climbed steadily since June and has registered a series of higher lows since then.
The inference was that, despite the sharp drop, the volume of Cardano bought in recent weeks far outweighed what was sold in that one week of heavy losses.
Conclusion
Bitcoin has moved in the same direction as the S&P 500 in recent weeks, albeit magnified. Bitcoin’s move to $24k saw a sharp rejection, further reinforcing the bias of long-term bears.
For Cardano, the trend was bearish, but a low-risk buying opportunity might arise if ADA dipped to $0.4, targeting $0.54. The trade would be invalidated on a daily session close beneath $0.4.