Assessing if Shiba Inu’s [SHIB] price momentum is too good to hold

Shiba Inu [SHIB] has seen quite an uptrend in price lately, with gains of over 2% in the last 24 hours. This has effectively reduced its losses over the last seven days to just around 1.63%. Now, although it is still over 60% off its all-time high, recent moves have been positively received by its holders.
How is SHIB doing on the metrics front?
Worth pointing out, however, that SHIB has been seeing some growth on other fronts too, not just on the price front. The number of addresses, for instance, has been on a steady hike over the long and short term.
Between 19 and 24 September, over 3,000 new addresses that hold assets were registered on the network, as per CoinMarketcap.
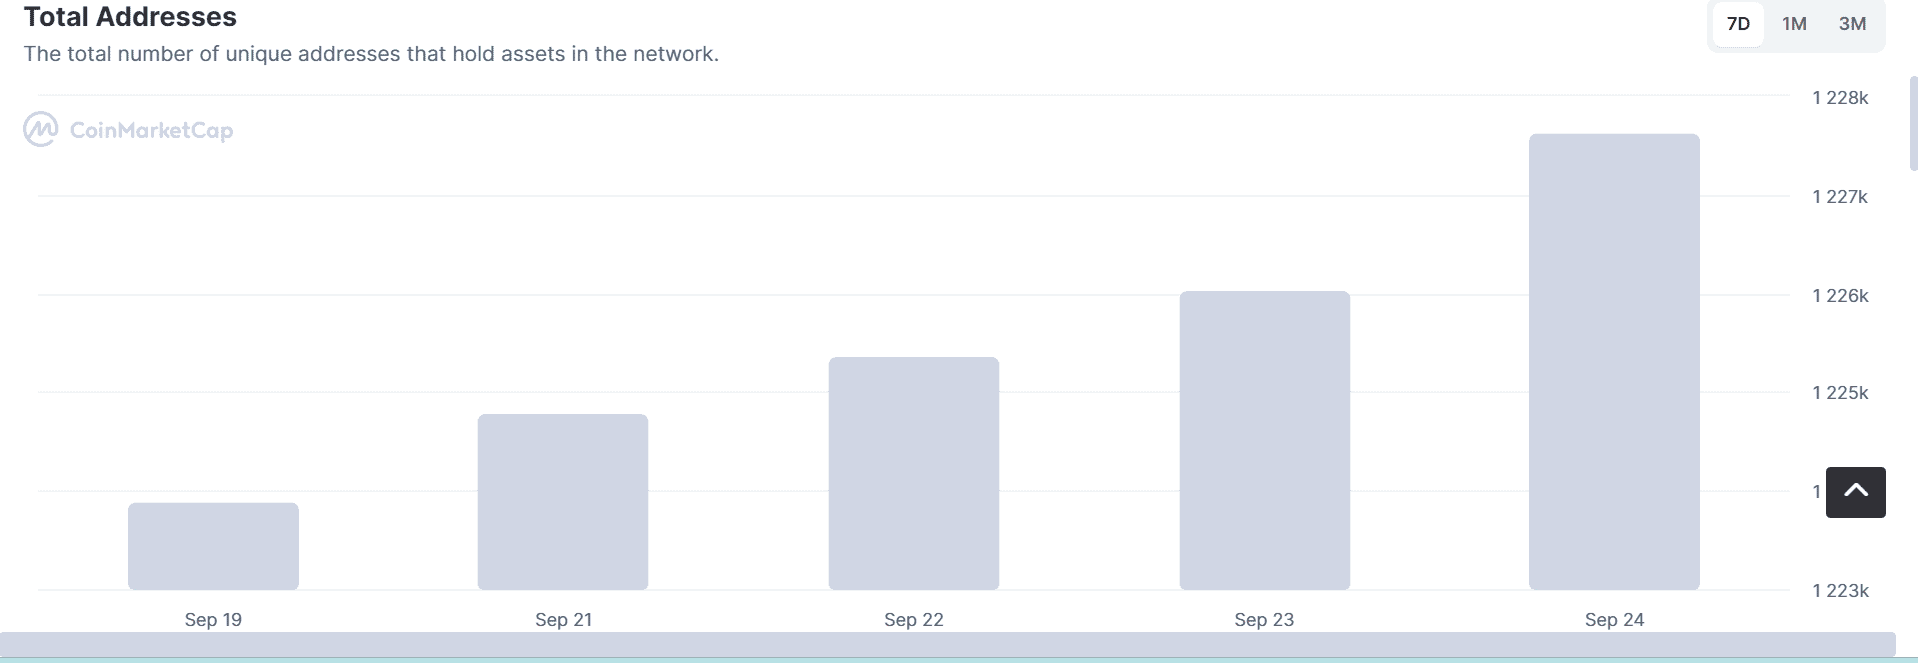
Over 35,000 new holders have been added to the network in the space of 3 months. This, despite SHIB not noting a strong price performance over that period.
The total number of addresses stood at 1,227,617, at press time. This represented a hike of 3% from its figures for total number of addresses in June.

According to Shibburn, out of the 1 quadrillion Shiba Inu tokens issued on launch day, approximately 41% of the circulating supply has already been destroyed.
Additionally, the daily average number of SHIB tokens “burned” and sent to the dead wallet is around 150 million. In fact, the current burn rate is around 250%.
What do the price charts say?
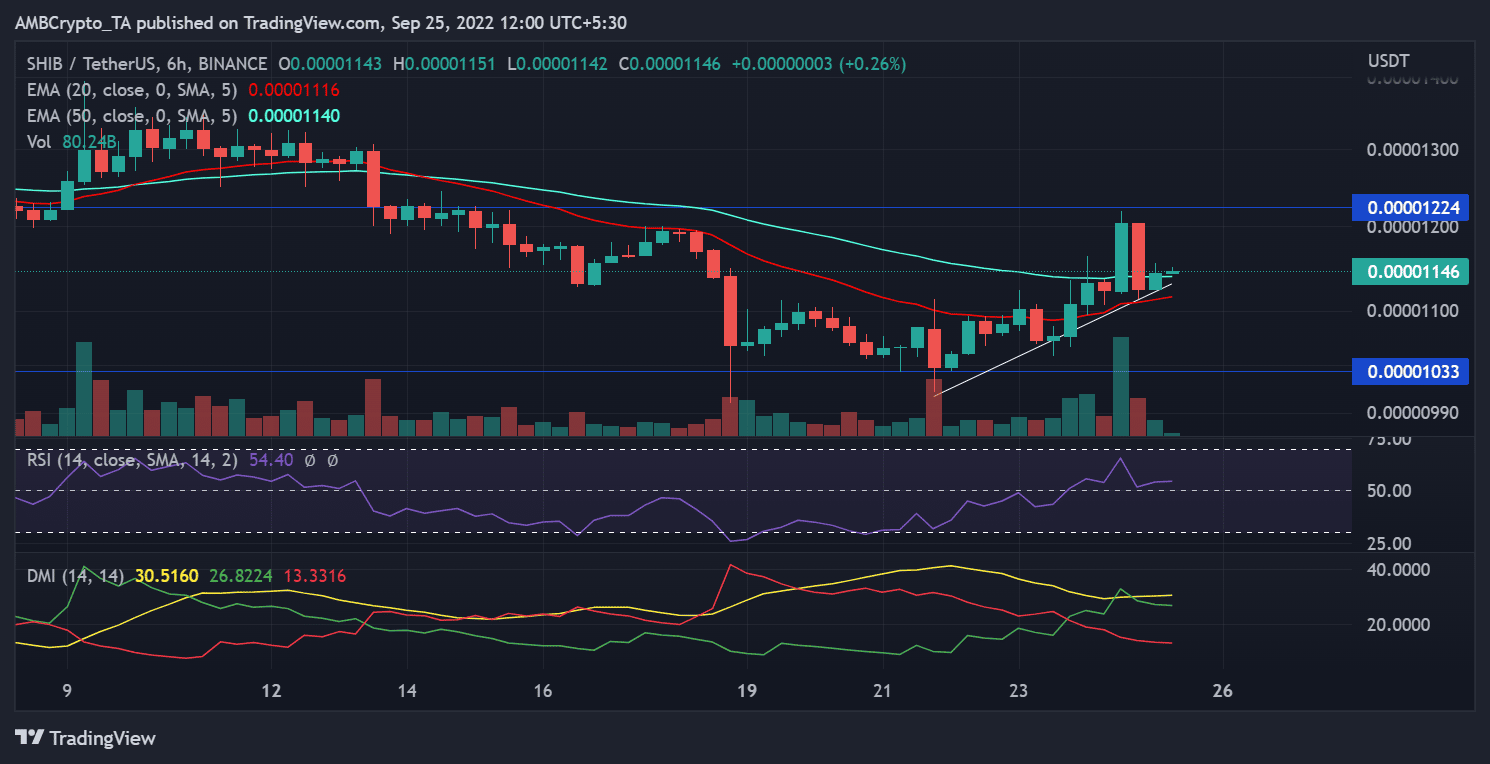
Taking a look at SHIB’s price movement over a 6-hour period, the resistance level was found to be around $0.00001224 while the support was around $0.0001033. The Relative Strength Index (RSI) flashed a fairly bullish trend with the RSI angling north a bit from the neutral line.
The Directional Movement Indicator (DMI) also seemed to be showing the signal and plus DI line above 20 – A bullish move. The 6-hour timeframe highlighted an upward trend in terms of price action between 22-24 September.
Looking at the RSI on the 24-hour time frame, the overall trend was still bearish, albeit a weakening one. The DMI on the same timeframe revealed the Signal line and the plus DI resting barely over 20, also indicating a waning bearish trend and the possible start of a bullish one.
The Volume indicator underlined decent trade activities with buyers taking a larger percentage of the trade volume.
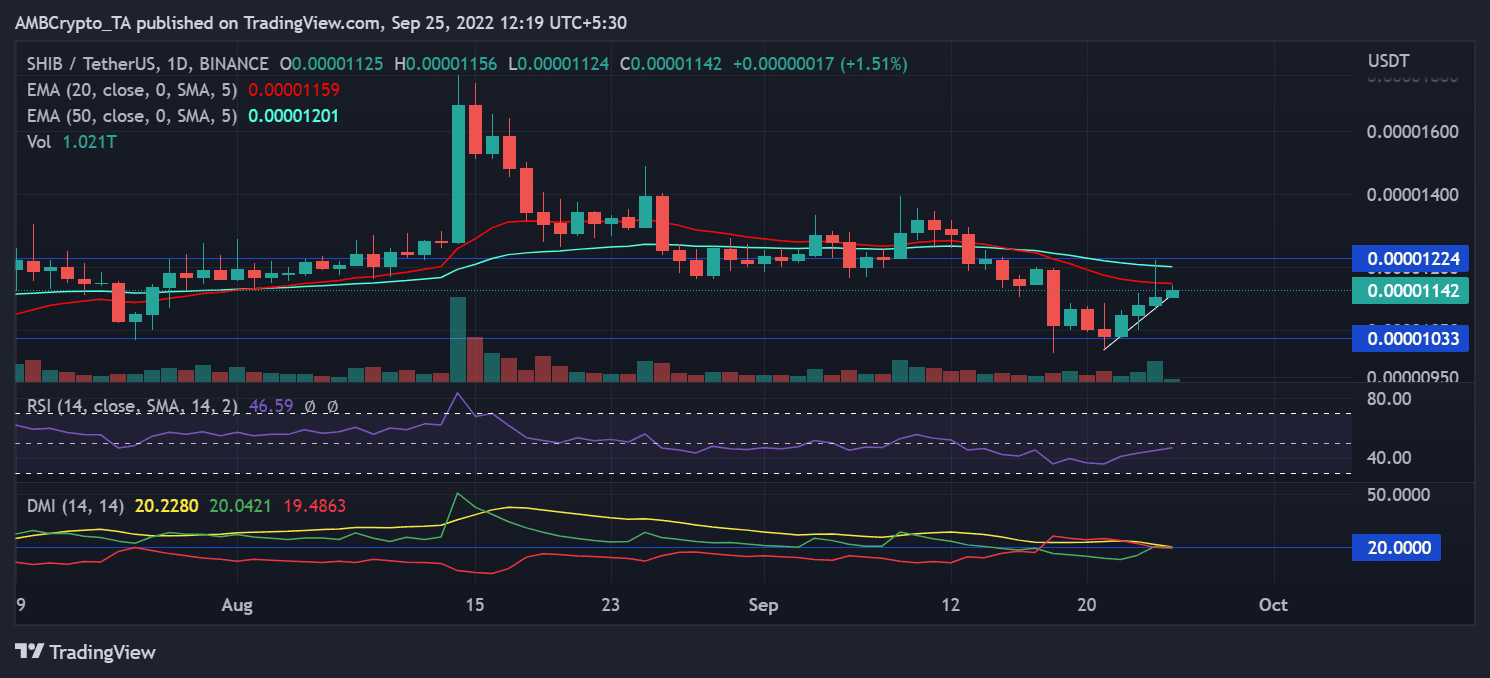
If the buying pressure persists, we might see SHIB break its press time resistance. Once it breaks the same and is able to form new support, a further upward trend is to be expected. We could see it test the $0.00001400-region. Over 30% of SHIB investors have been holding it for over a year, according to Into the block metrics. In fact, 67% have also been holding it for 1-12 months.
Furthermore, more than 4.5 trillion SHIB tokens have been transferred by the largest whales on Ethereum in the last 3 days.
Despite such impressive narratives, could SHIB face yet another resistance wall? Let’s wait and watch.


