Shiba Inu [SHIB] buyers may want to consider this before taking a long position

Disclaimer: The findings of the following analysis are the sole opinions of the writer and should not be considered investment advice.
After breaking out of its falling wedge in early September, Shiba Inu’s [SHIB] bull run saw an expected reversal from the $0.0134-$0.0138 resistance range. (For brevity, SHIB prices are multiplied by 1,000 from here on).
Consequently, the sellers re-entered the market to propel a pull towards the lower band of the Bollinger Bands (BB) in a reversal pattern.
Going forward, a plausible U-turn from the confluence of resistances near the basis line (green) of the BB can hinder the recently-found buying pressure. At press time, SHIB was trading at $0.01133.
SHIB Daily Chart
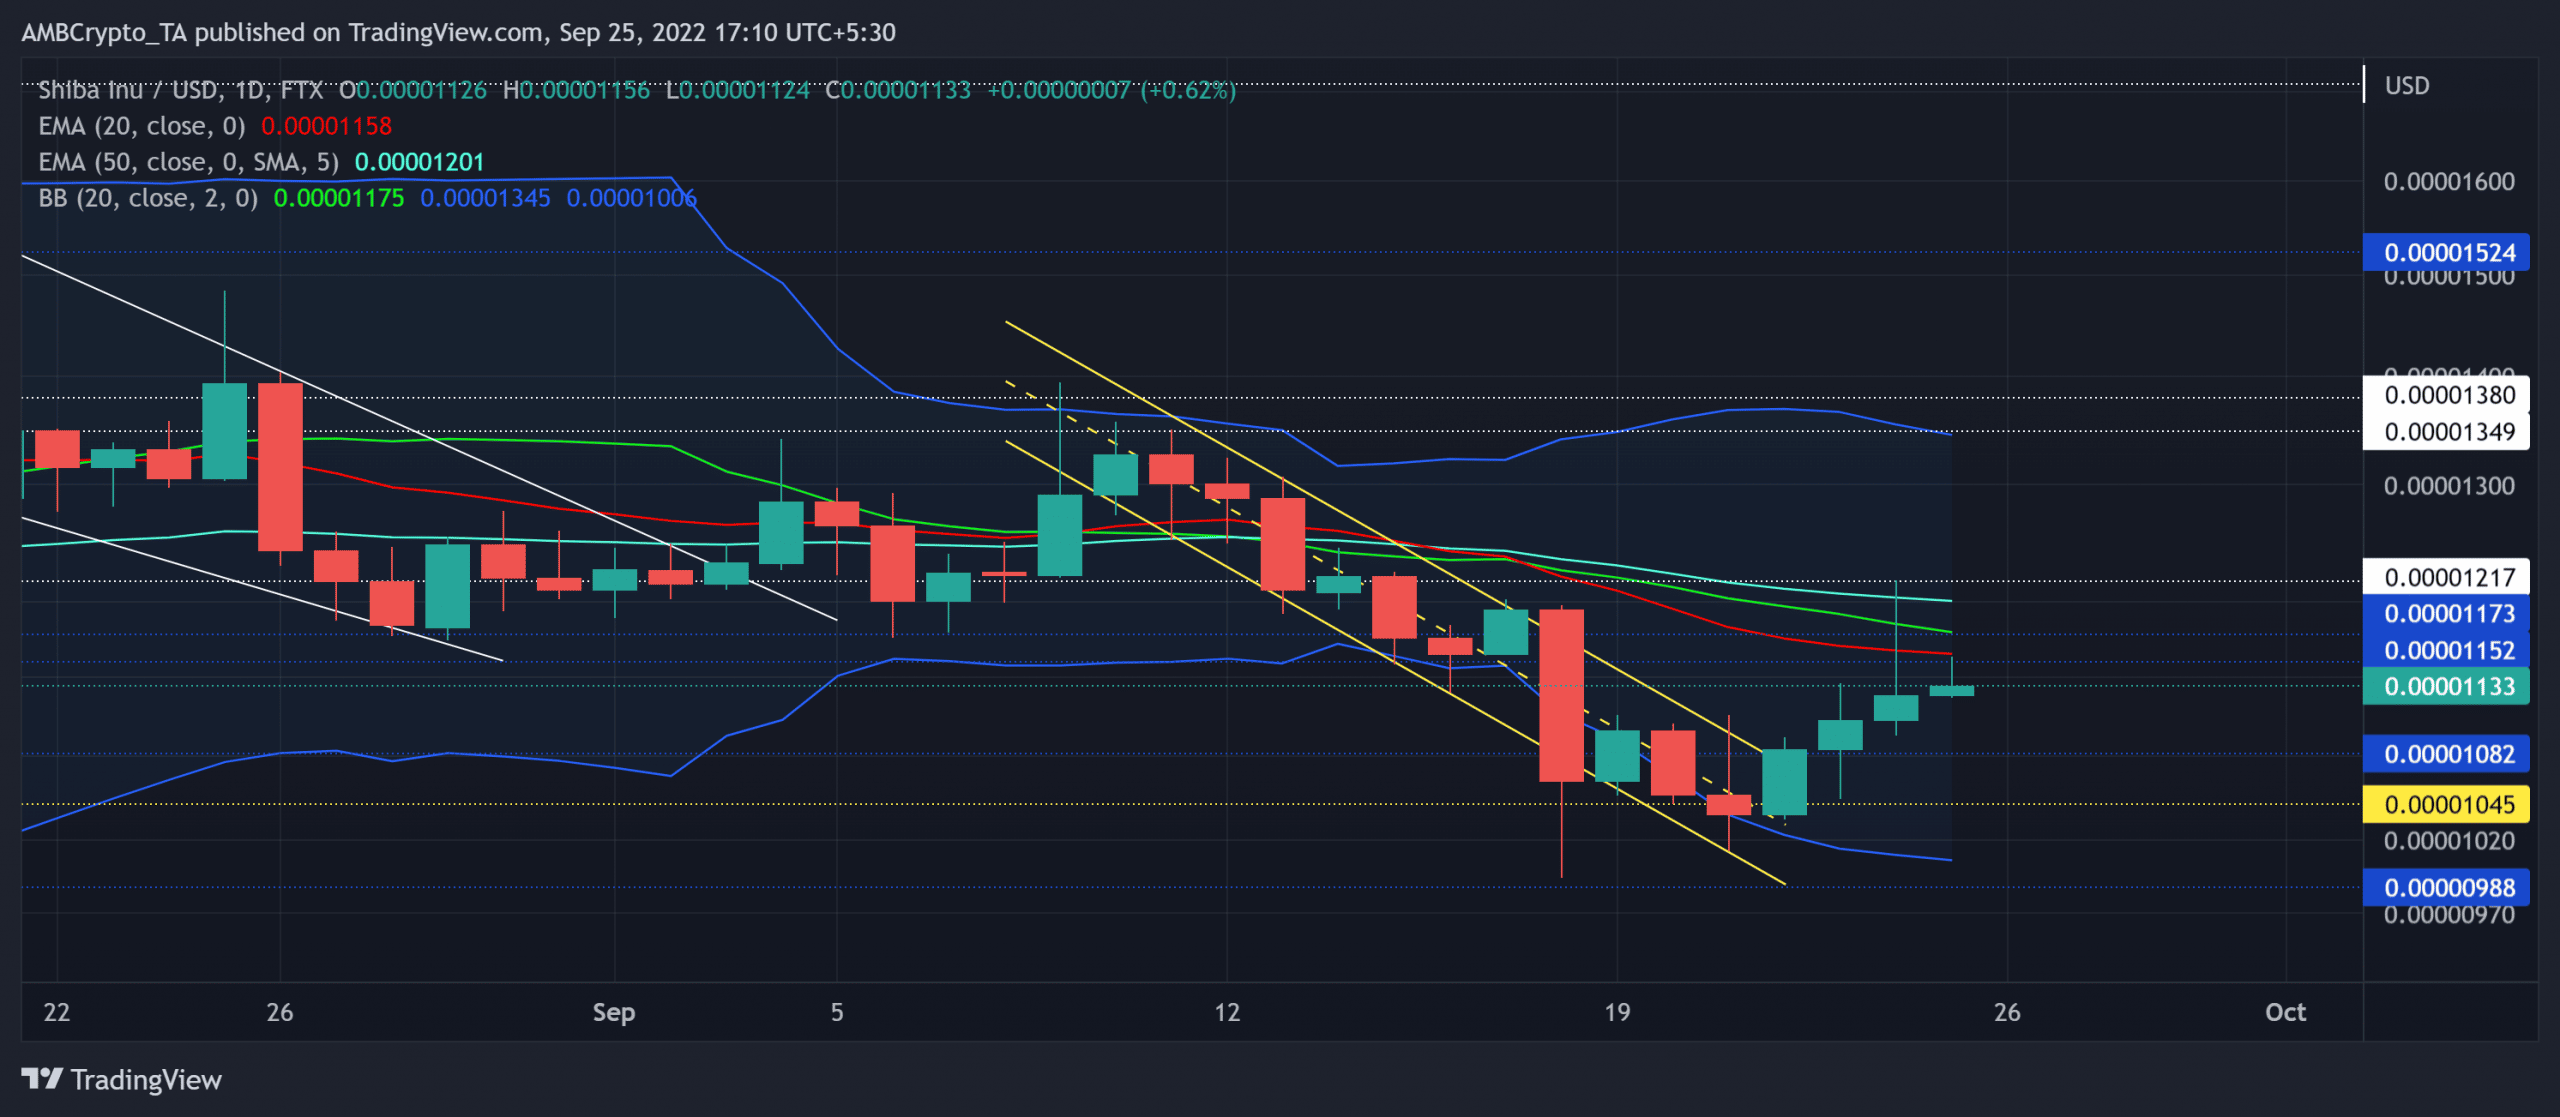
Post inflicting a concrete bullish volatile break in mid-August, SHIB sellers pulled the altcoin towards its sideways track in the $0.01217-$0.0134 range.
After oscillating in this range for nearly a month, the selling pressure kept mounting on its baseline support. The resultant decline shaped into a down-channel (yellow) that pulled SHIB below its 20/50 EMA alongside the basis line to paint a bearish picture.
However, the recent down-channel breakout tested the 50 EMA (cyan) and the $0.01217-resistance (previous support). Also, a bearish hammer candlestick reaffirmed the selling intentions to constrict the buying power in the $0.0115-$0.012 range.
With the near-term EMAs still looking south, sellers would look to sustain their momentum in the coming sessions. A decline below the immediate resistance can propel a retracement toward the $0.0104-$0.0108 range.
Any jump above the $0.01217-level would confirm the invalidation of the press time bearish bias. In these circumstances, buyers would look to test the upper band of the BB.
Rationale

The bears were quick to undermine the bullish pressure and pull the Relative Strength Index (RSI) back into the bearish zone. A sustained sway below the midline would keep aiding the selling efforts in the coming times.
To top it up, the Chaikin Money Flow’s (CMF) and Accumulation Distribution’s (A/D) lower peaks over the last few days bearishly diverged with the price action. These readings resonated with the broader bearish outlook.
Conclusion
Given the bearish hammer candlestick from the 20/50 EMA and the basis line resistances, SHIB could see a near-term setback before picking itself up.
Any breach above $0.01217 could confirm a bearish invalidation. In either case, the targets would remain the same as discussed.
Finally, the altcoin shares a 73% 30-day correlation with Bitcoin. Hence, keeping an eye on Bitcoin’s movement with overall market sentiment would be essential in identifying any bullish invalidations.