Avalanche: Mapping entry triggers to achieve optimal Risk-to-Reward ratio

Disclaimer: The findings of the following analysis are the sole opinions of the writer and should not be considered investment advice
- Avalanche witnessed a patterned breakdown, can it find reliable rebounding grounds?
- The crypto’s Open Interest and Long/short ratio revealed an edge for the short sellers.
As the buyers strived to alter the trend to their fancy, the reversal from the $30-ceiling restored the selling pressure. As a result, Avalanche [AVAX] tumbled below its 20, 50/200 EMA to witness a robust bearish resurgence.
Here’s AMBCrypto’s price prediction for Avalanche [AVAX] for 2023-24
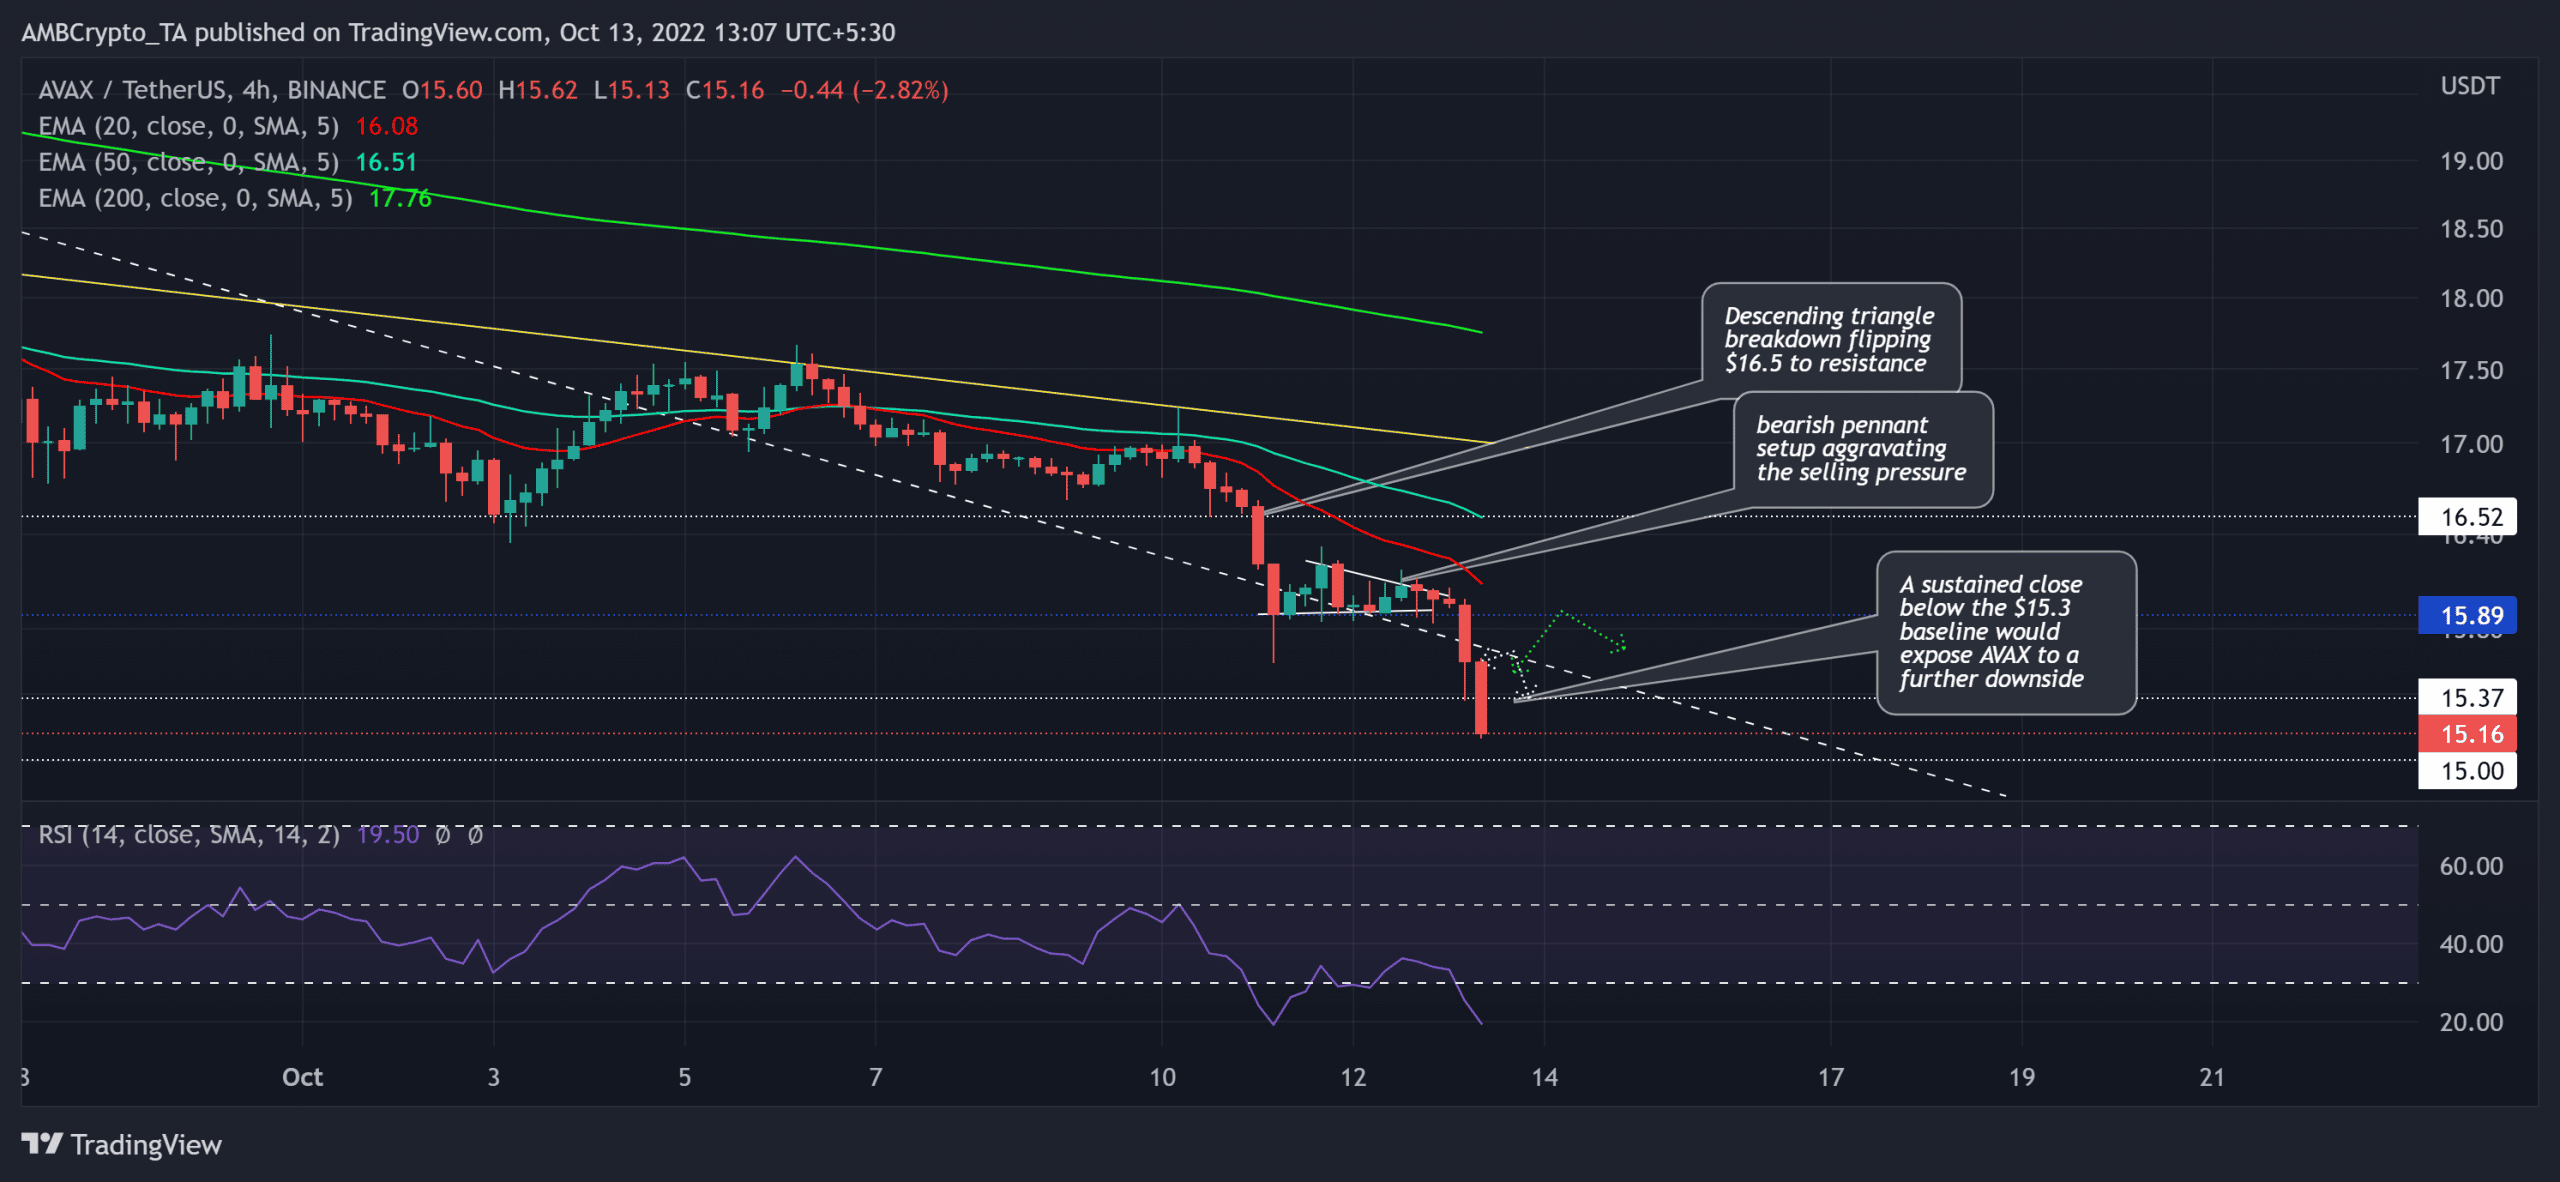
In quest of finding newer lows, the alt outlined a two-month trendline resistance (white, dashed). The bears could now aim to expedite their edge should the recent patterned break fail to find reliable grounds.
At press time, AVAX was trading at $15.16, down by nearly 5% in the last 24 hours.
AVAX’s previous bull run halted at the $30-level after exponential gains from its 10-month lows in July. The subsequent reversal from this ceiling noted a rising wedge breakdown in the four-hour timeframe.
While the two-month trendline resistance constricted the buying efforts, for the most part, AVAX marked an expected descending triangle breakdown, one that spurred an over 5% loss in just the last two days.
Meanwhile, the 20 EMA (red) and 50 EMA (cyan) looked south while unveiling the underlying selling edge. After a relatively high volatile move over the last two days, AVAX has entered a low liquidity zone at press time. This makes the coin more fragile to substantial movements in the coming sessions.
After breaking down from its bearish pennant, an inability to jump above the immediate trendline resistance can position the alt for a downside.
A close below the $15.3 baseline would confirm the chances of an extended downside. In these circumstances, the sellers could look to test the $14-$15 range support.
On the flip side, a plausible rebound from the immediate support above the trendline resistance can aid the buyers in testing the 20/50 EMA before the $16.5 ceiling.
The Relative Strength Index (RSI) entered into the oversold region to exhibit a one-sided selling advantage. A likely revival from this zone can position the coin for a near-term recovery in the coming sessions.
A decline in Open Interest alongside the price

An analysis of AVAX Futures Open Interest revealed a 4.99% decline over the last 24 hours. Correspondingly, the price action declined similarly over the past day.
Generally, a decline in both price and Open Interest indicated liquidation by discouraged traders having long positions, thus reflecting a bearish sentiment.
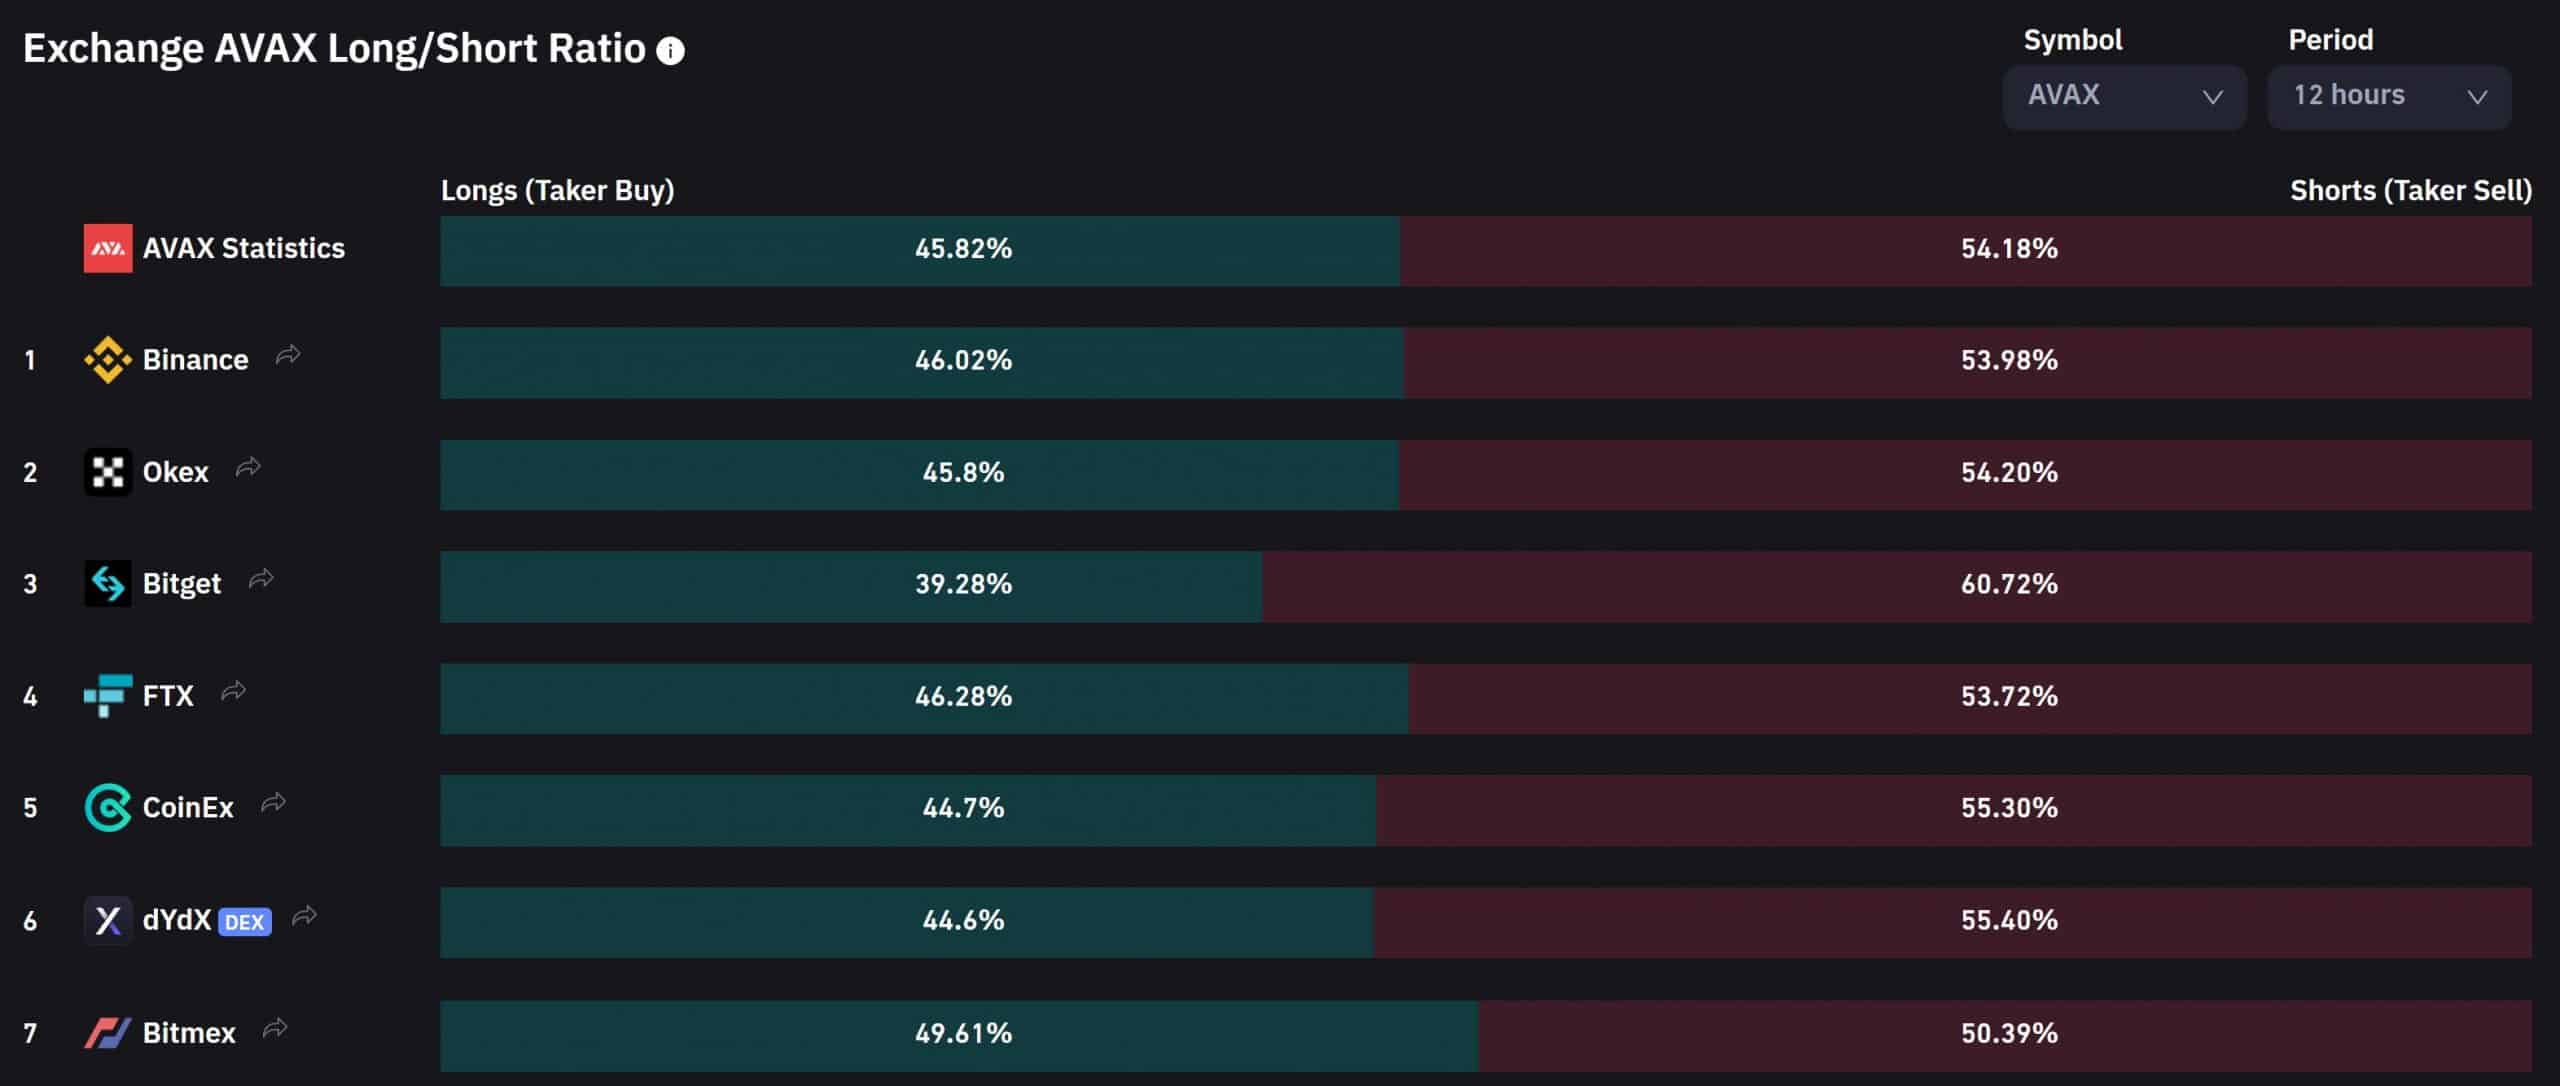
Additionally, the long/short ratio over the last 12 hours across all exchanges for AVAX revealed a slight edge for the short sellers. Finally, traders should factor in Bitcoin’s movement and its effects on the wider market to make a profitable move.


