Avalanche, NEAR, Algorand Price Analysis: 18 March

The past couple of days have seen Avalanche register strong gains in the market and reach a zone of supply. A retest of a former resistance level at $77.3 could be seen in the next few hours. NEAR has been trading within a range during March, while Algorand has seen some buying pressure recently and could push higher.
Avalanche (AVAX)
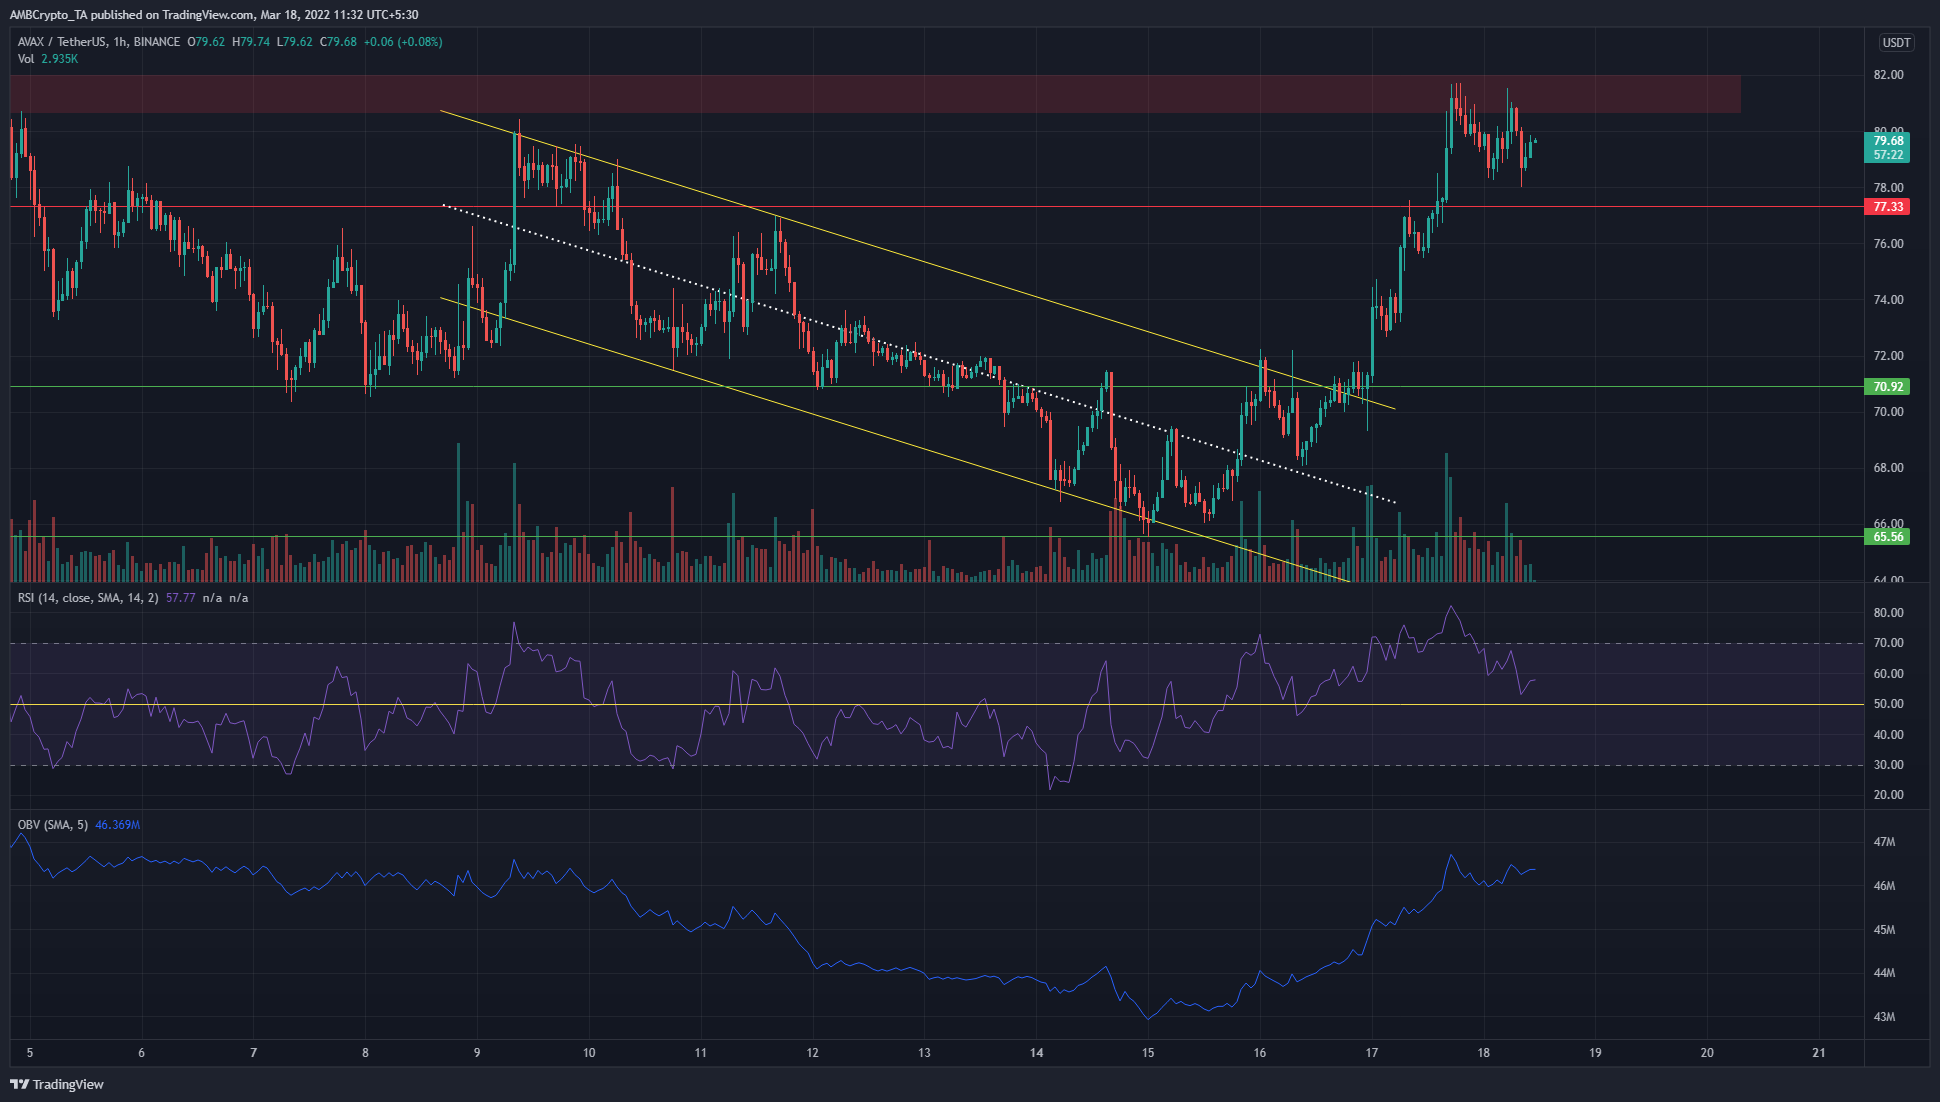
AVAX was trading within a descending channel (yellow) a couple of days ago and broke out decisively to reach the $81 supply zone (red box). This zone has had some significance in the past. For example, in early February, the price broke out past this area to test the $85 support, then retested $82 in search of demand and shot upward to reach $94 within the span of three days.
A similar scenario could unfold if AVAX can climb past the $82 area and flip it to a demand zone.
Near Protocol (NEAR)
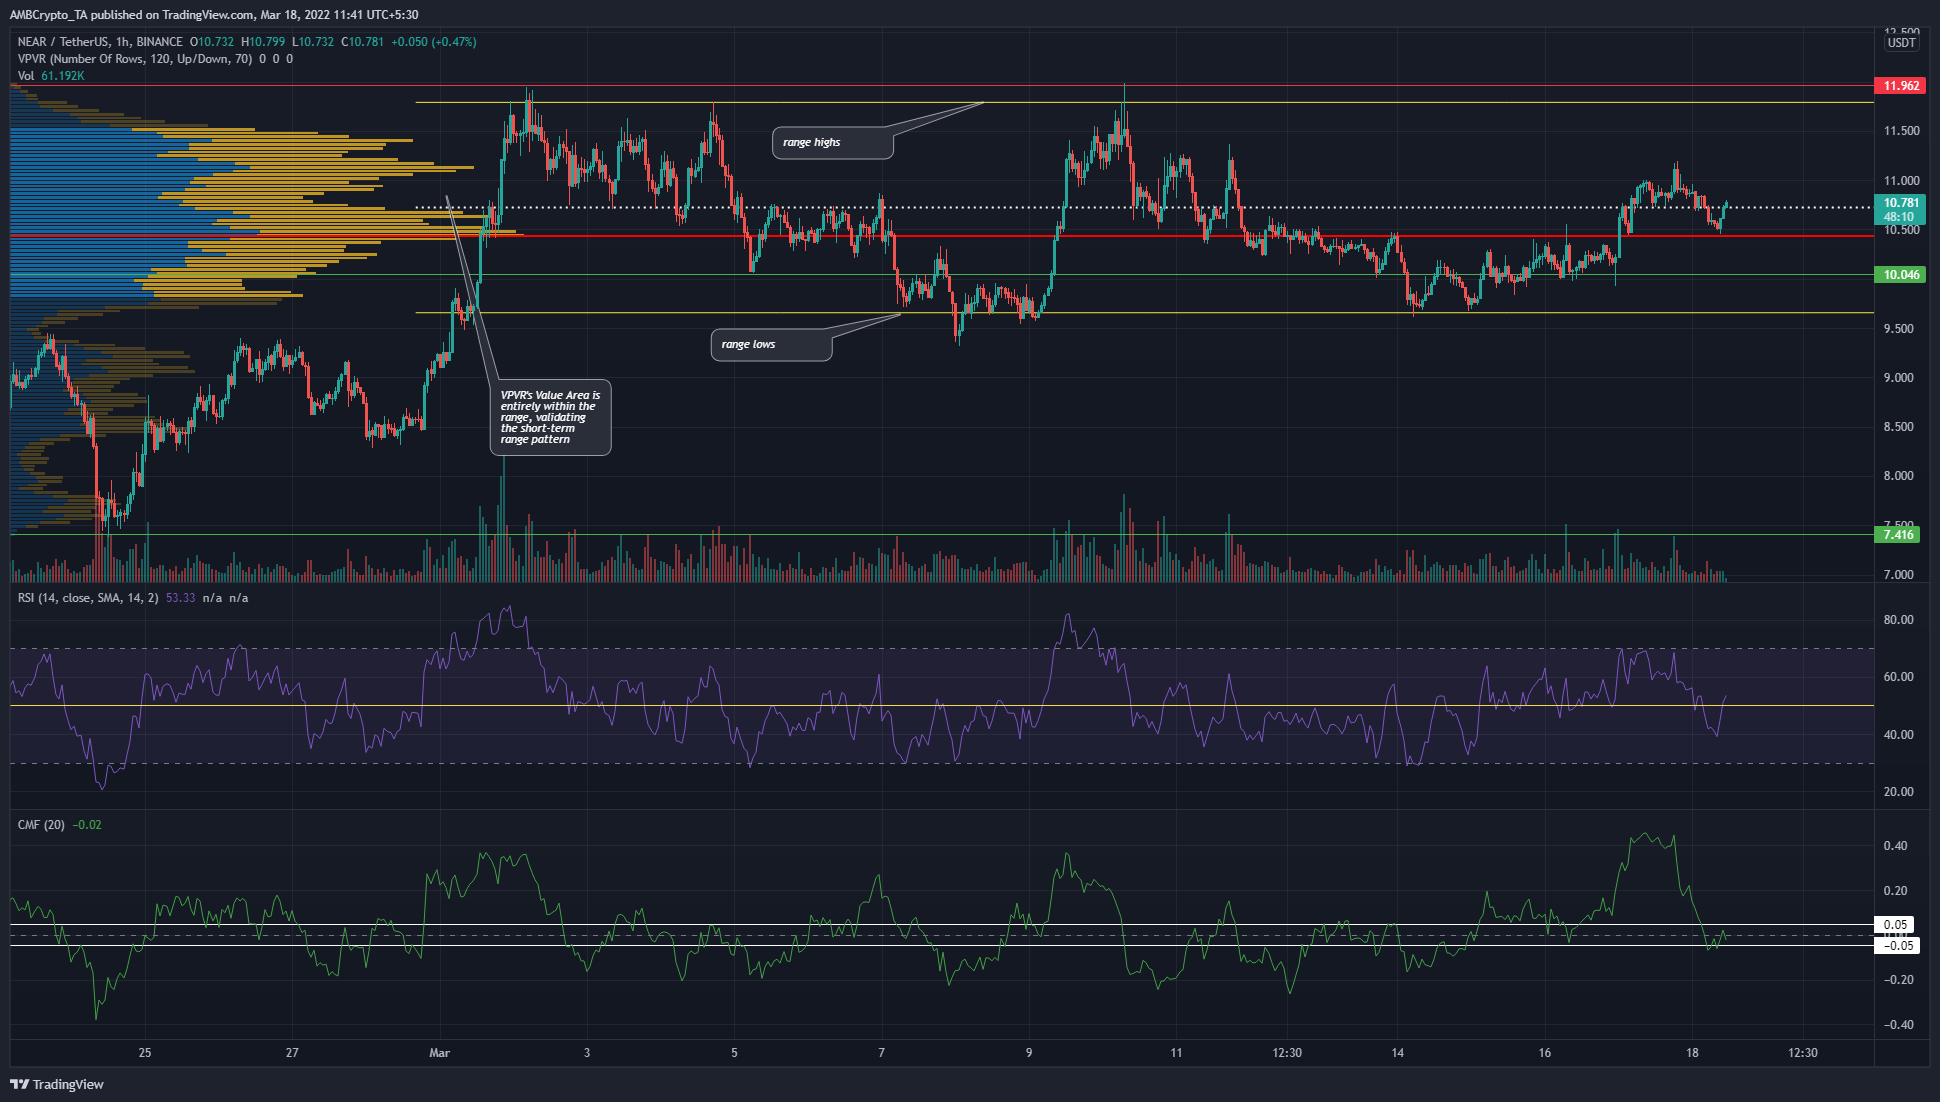
The Volume Profile Visible Range tool showed the Value Area was within the range (yellow) from $9.65 to $11.8. This range has been important for NEAR in the month of March. The Point of Control lay at $10.43, which represented a strong support level for the price apart from the mid-range level of $10.72.
The RSI climbed past neutral 50 even as NEAR bounced from the POC and pushed past $10.72 which indicated that the price could be headed toward the range highs once more. The CMF was in neutral territory, and if this indicator climbs past +0.05, it would be more evidence of a bullish push toward the $11.8 range highs.
Algorand (ALGO)
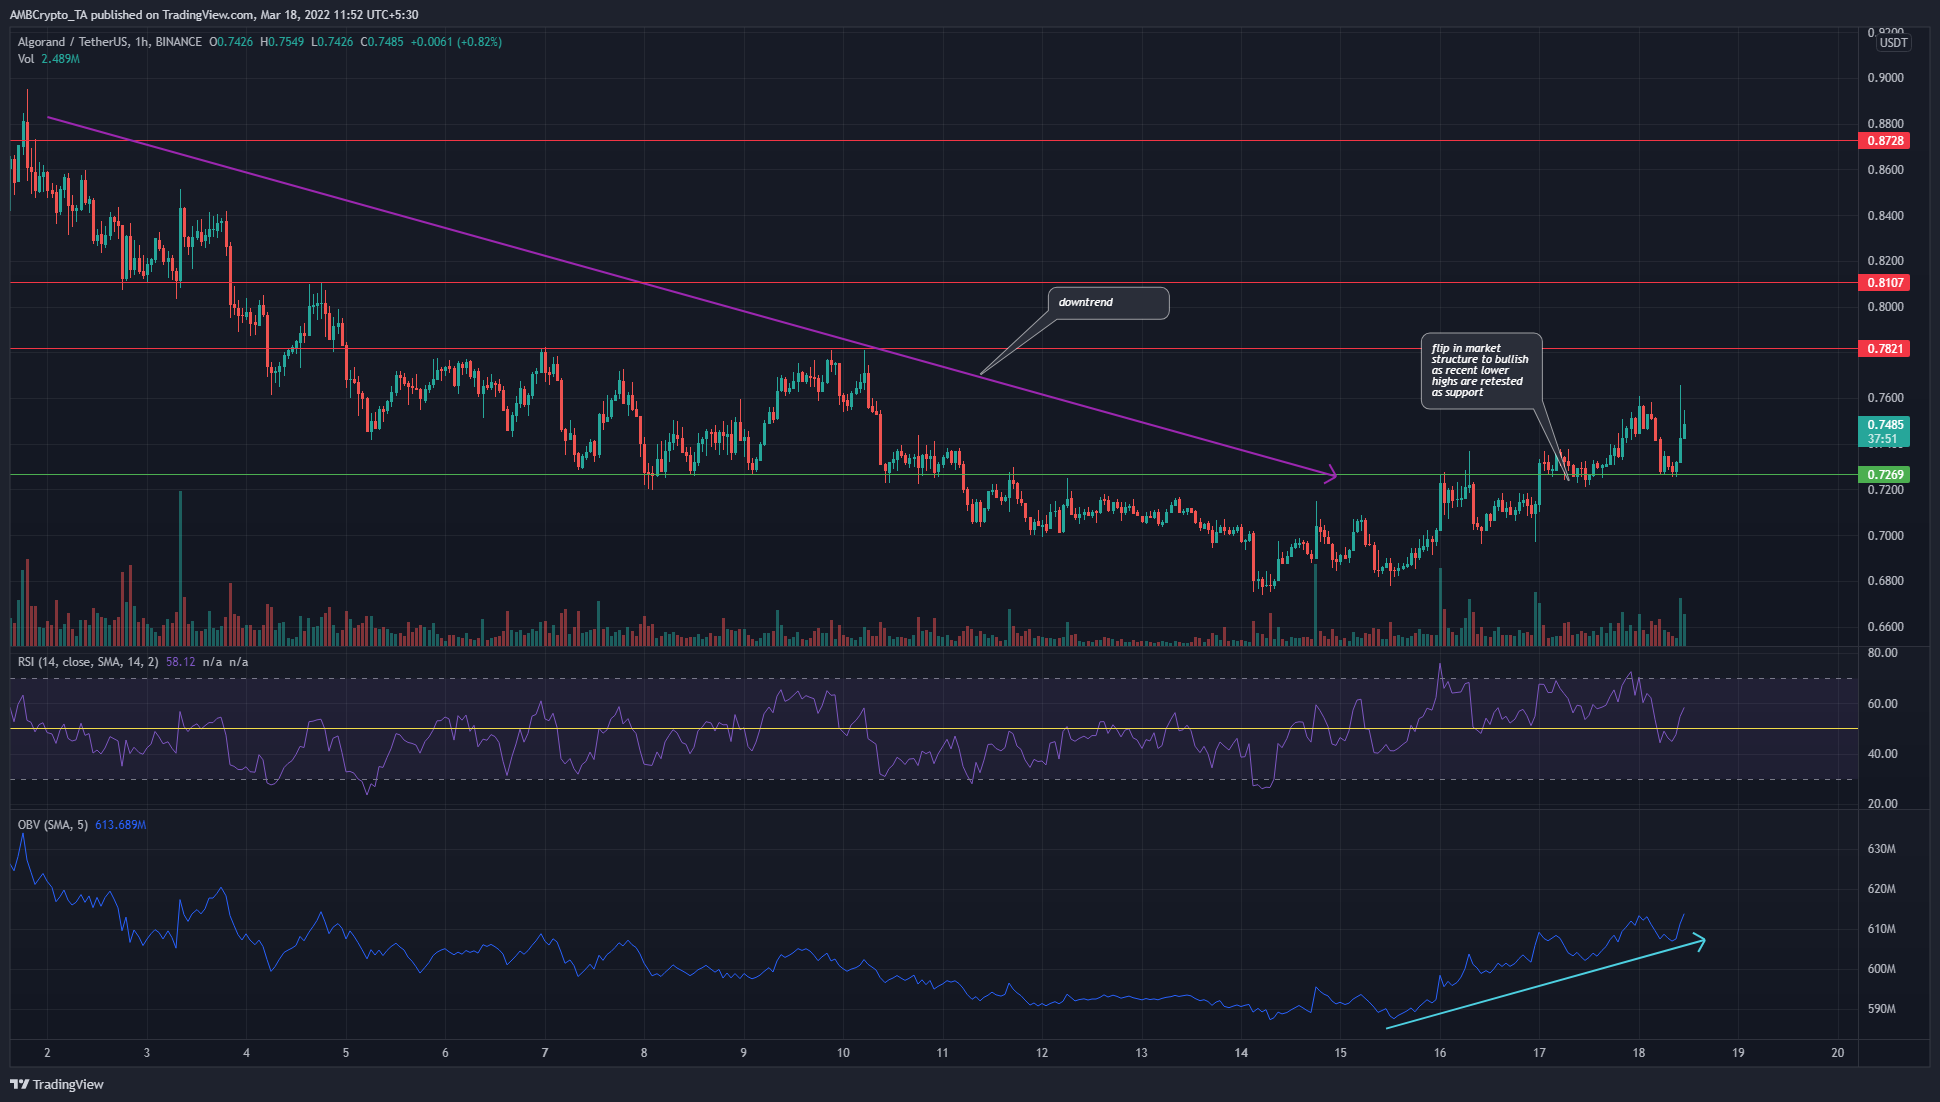
The trend had been bearish for ALGO in the past two weeks as the price set a series of lower highs on the charts. However, the past couple of days saw a break in the bearish market structure when the $0.73 level, a lower high in the downtrend, was broken.
On the 16th of March, ALGO pushed past $0.73 to form a higher low at $0.73, and has climbed upward since. In the same time period, the RSI stayed above neutral 50 for the most part to indicate an uptrend in progress. The OBV also showed steady buying volume to point toward a rally driven by demand.


