Avalanche, Polkadot, NEAR Protocol Price Analysis: 20 April

Bitcoin faced resistance from the $41.5k level and has been trading sideways the previous day. Its swift move past the $40k mark has seen the altcoin market assume a bullish outlook as well. Avalanche faces strong resistance from the $82 area, while Polkadot and NEAR offered near-term buying opportunities.
Avalanche (AVAX)
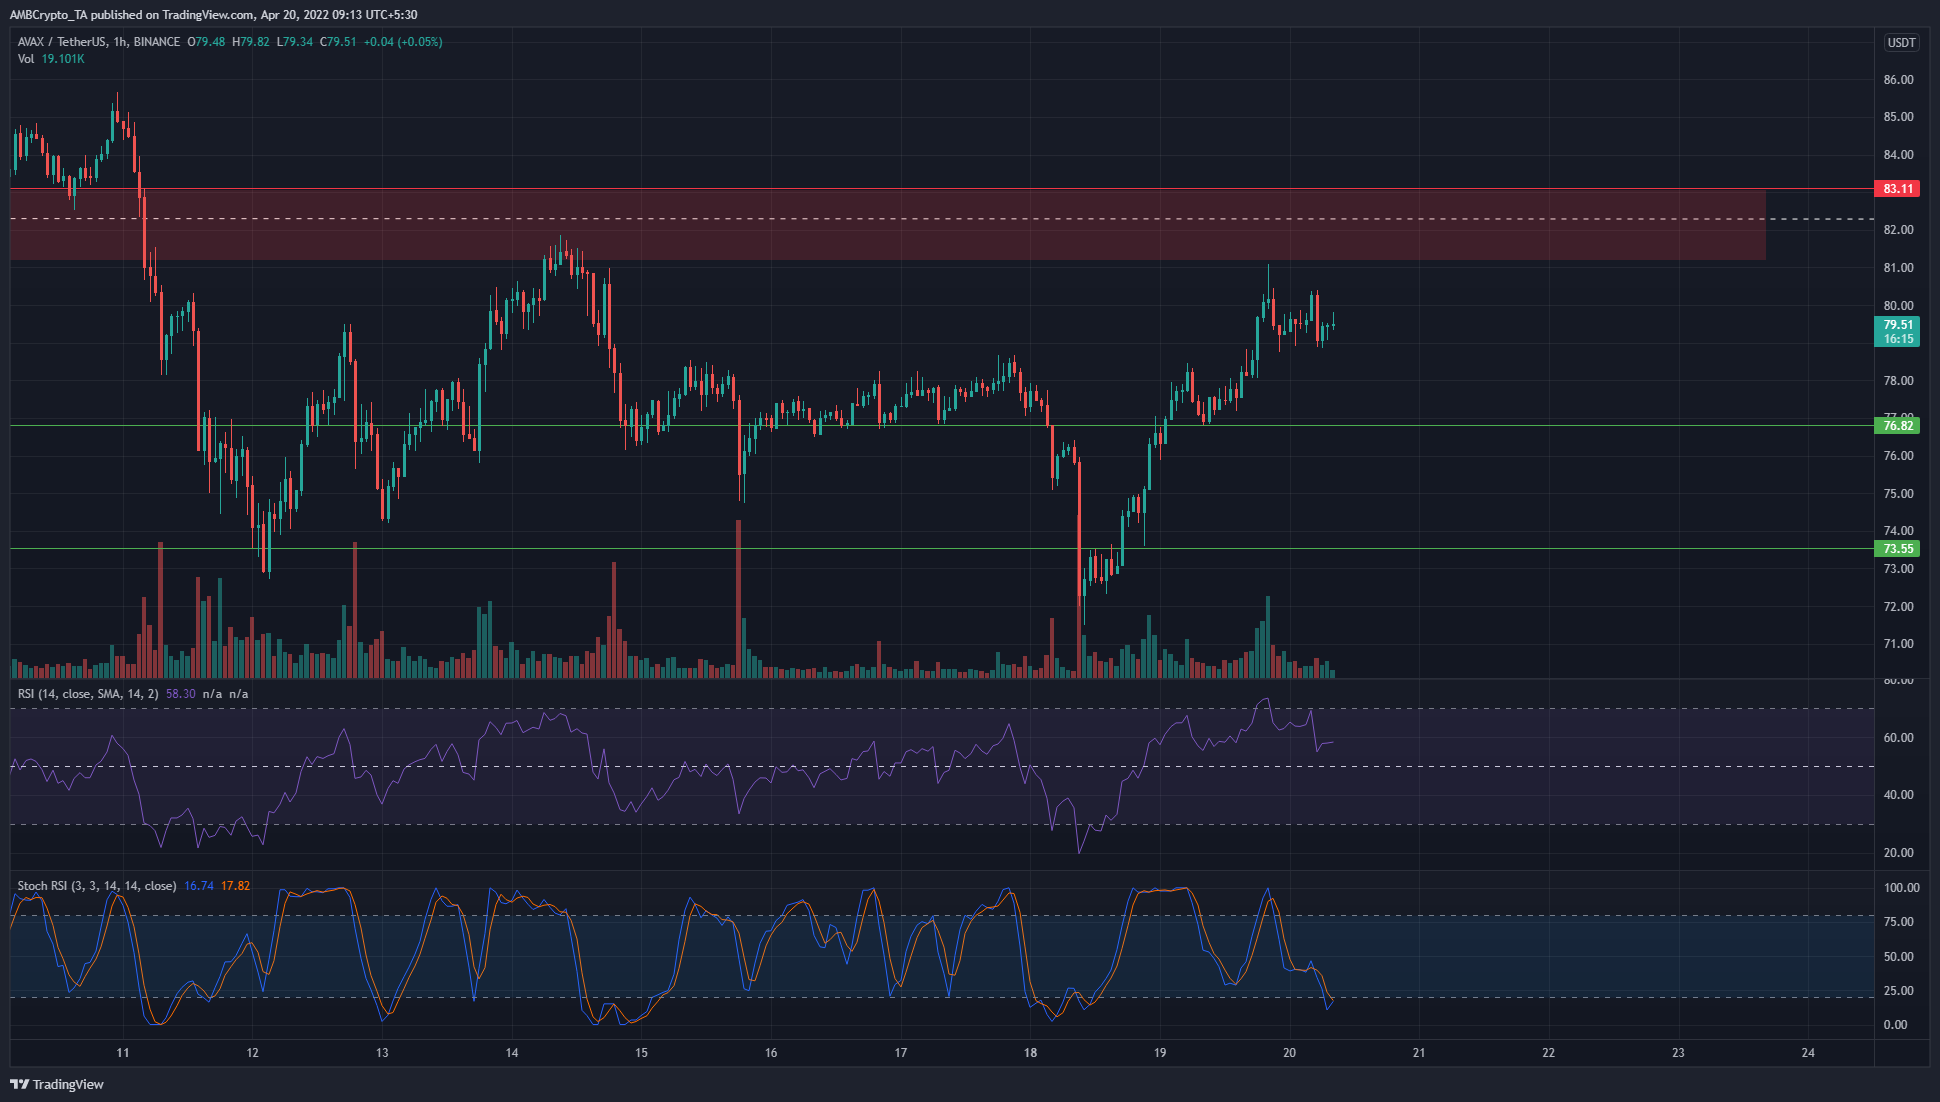
Avalanche is trading within a range from $65.5 to $98.8. The mid-point of this channel lies at $82 and is a zone of resistance over the next few hours. However, the RSI remains above neutral 50 on the hourly chart and bullish momentum remains. The Stochastic RSI dipped into oversold territory and looked to be on the verge of forming a bullish crossover.
Over the next few hours, the $78-$78.5 area could be revisited in search of demand. This could be a buying opportunity, with a stop-loss beneath the $76.8 support level.
Polkadot (DOT)
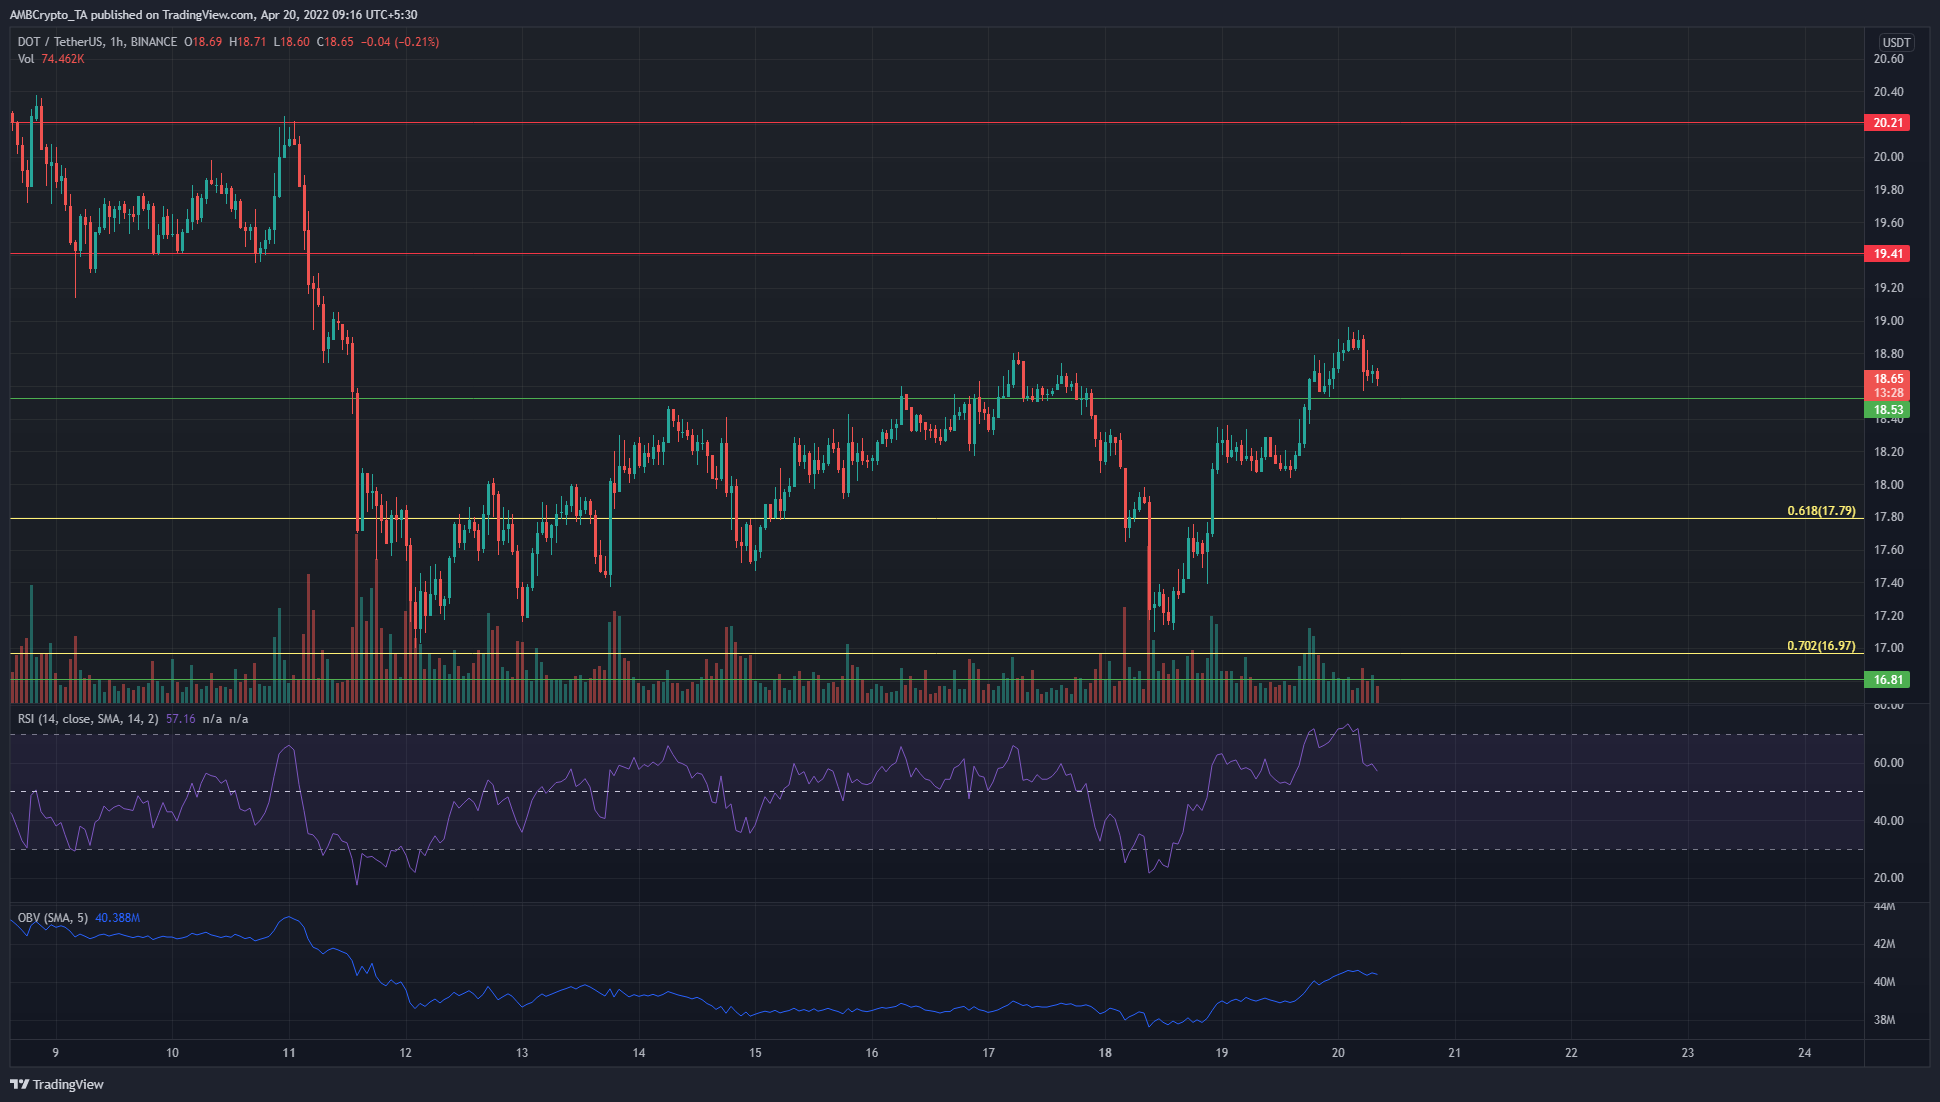
Polkadot also rose above a former level of resistance at $18.5, and over the next few hours, it could retest the same level as support before another move upward. The OBV had been in a downtrend in the past week, but this changed.
In the past two days, the price dipped to the $17 area and has seen a strong bounce since. Alongside, the OBV has also seen an uptick, while the RSI continued to stay above the zero line. Taken together, the presence of bullish momentum and demand could spur the prices higher toward $19.4 and $20.
NEAR Protocol (NEAR)
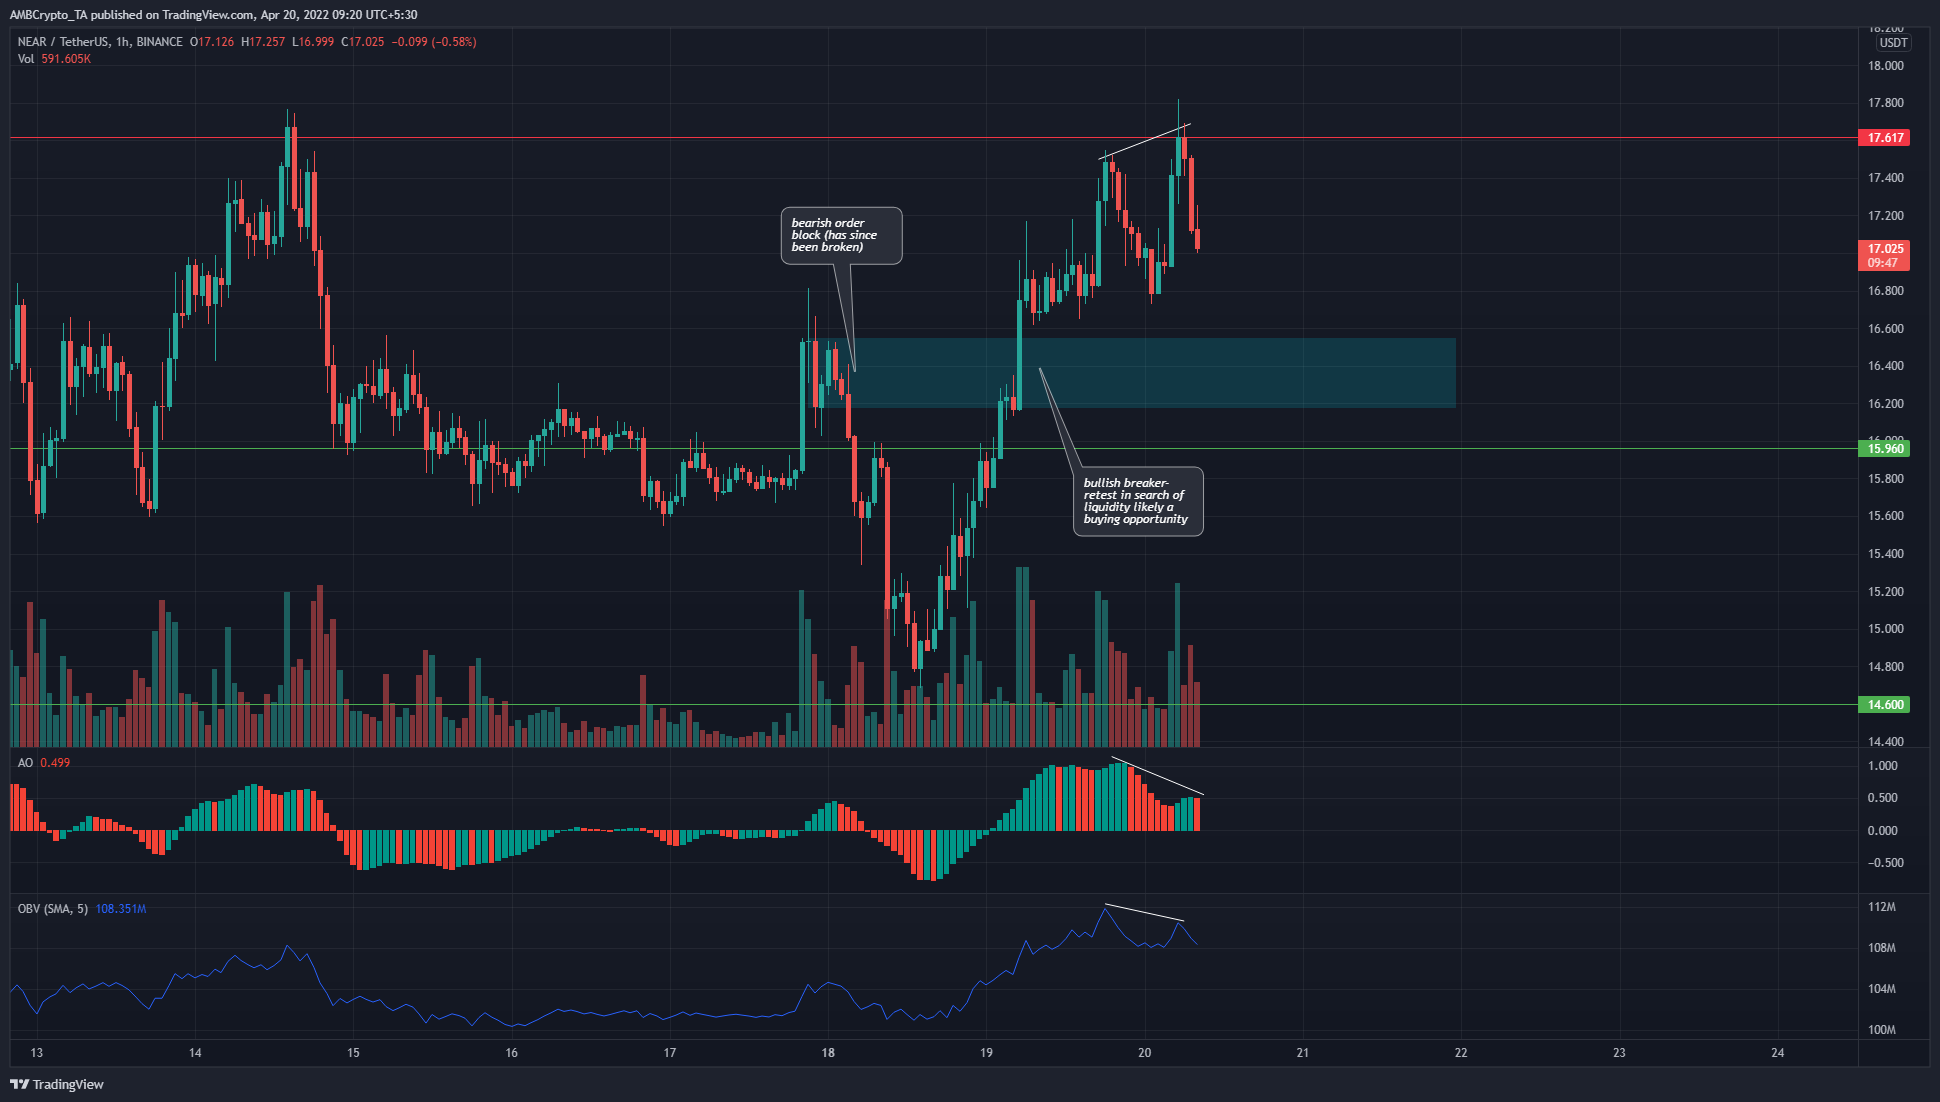
NEAR saw a bearish divergence between the price and the indicators. The price made a higher high the previous day. At the same time, the Awesome Oscillator and the OBV made a lower high. This divergence was likely to see a pullback for NEAR.
How deep would the pullback go? On the charts is an important near-term area of significance at $16.4. It was a bearish order block in the past few days, and the price has broken cleanly past this area.
This sets up a bullish breaker, which means the $16.4 area is a place where NEAR could revisit to collect the sidelined liquidity before forcing another move higher toward $20.