Avalanche, Solana, Fantom Price Analysis: 03 January

While the bulls endeavored to skew the sentiment in their favor, the bears refrained from giving up their edge as the crypto fear and greed index stood below 30 at press time.
However, Avalanche kept its bullish tendencies alive after its near-term SMA stayed above the long-term SMA’s. Besides, Solana was range-bound after flashing low volatility. Contrarily, Fantom formed a reversal pattern after witnessing exponential gains.
Avalanche (AVAX)

After the bearish flag breakdown, AVAX halted at the long-term golden Fibonacci support. After this, it registered a monstrous 67.8% ROI (from 13 December low) to poke its three-week high on 22 December.
Since then, the alt saw a 22.2% retracement until it bounced back from the 38.2% Fibonacci support. This descent also marked a descending broadening wedge (green) on its 4-hour chart.
Now, the alt saw a 3.5% 24-hour decline after a bearish divergence (white) between the RSI and price. Still, the 20 SMA (red) managed to stay above the 50 SMA (grey) and the 200 SMA (green). Any further retracements would find testing support at the $109-mark followed by the 38.2% Fibonacci level.
At press time, AVAX traded at $111.1. The RSI found near-term support at the half-line while flashing neutral signs. During the latest pullback phase, the OBV marked higher peaks, indicating a likely reversal. However, the ADX displayed a weak directional trend.
Solana (SOL)
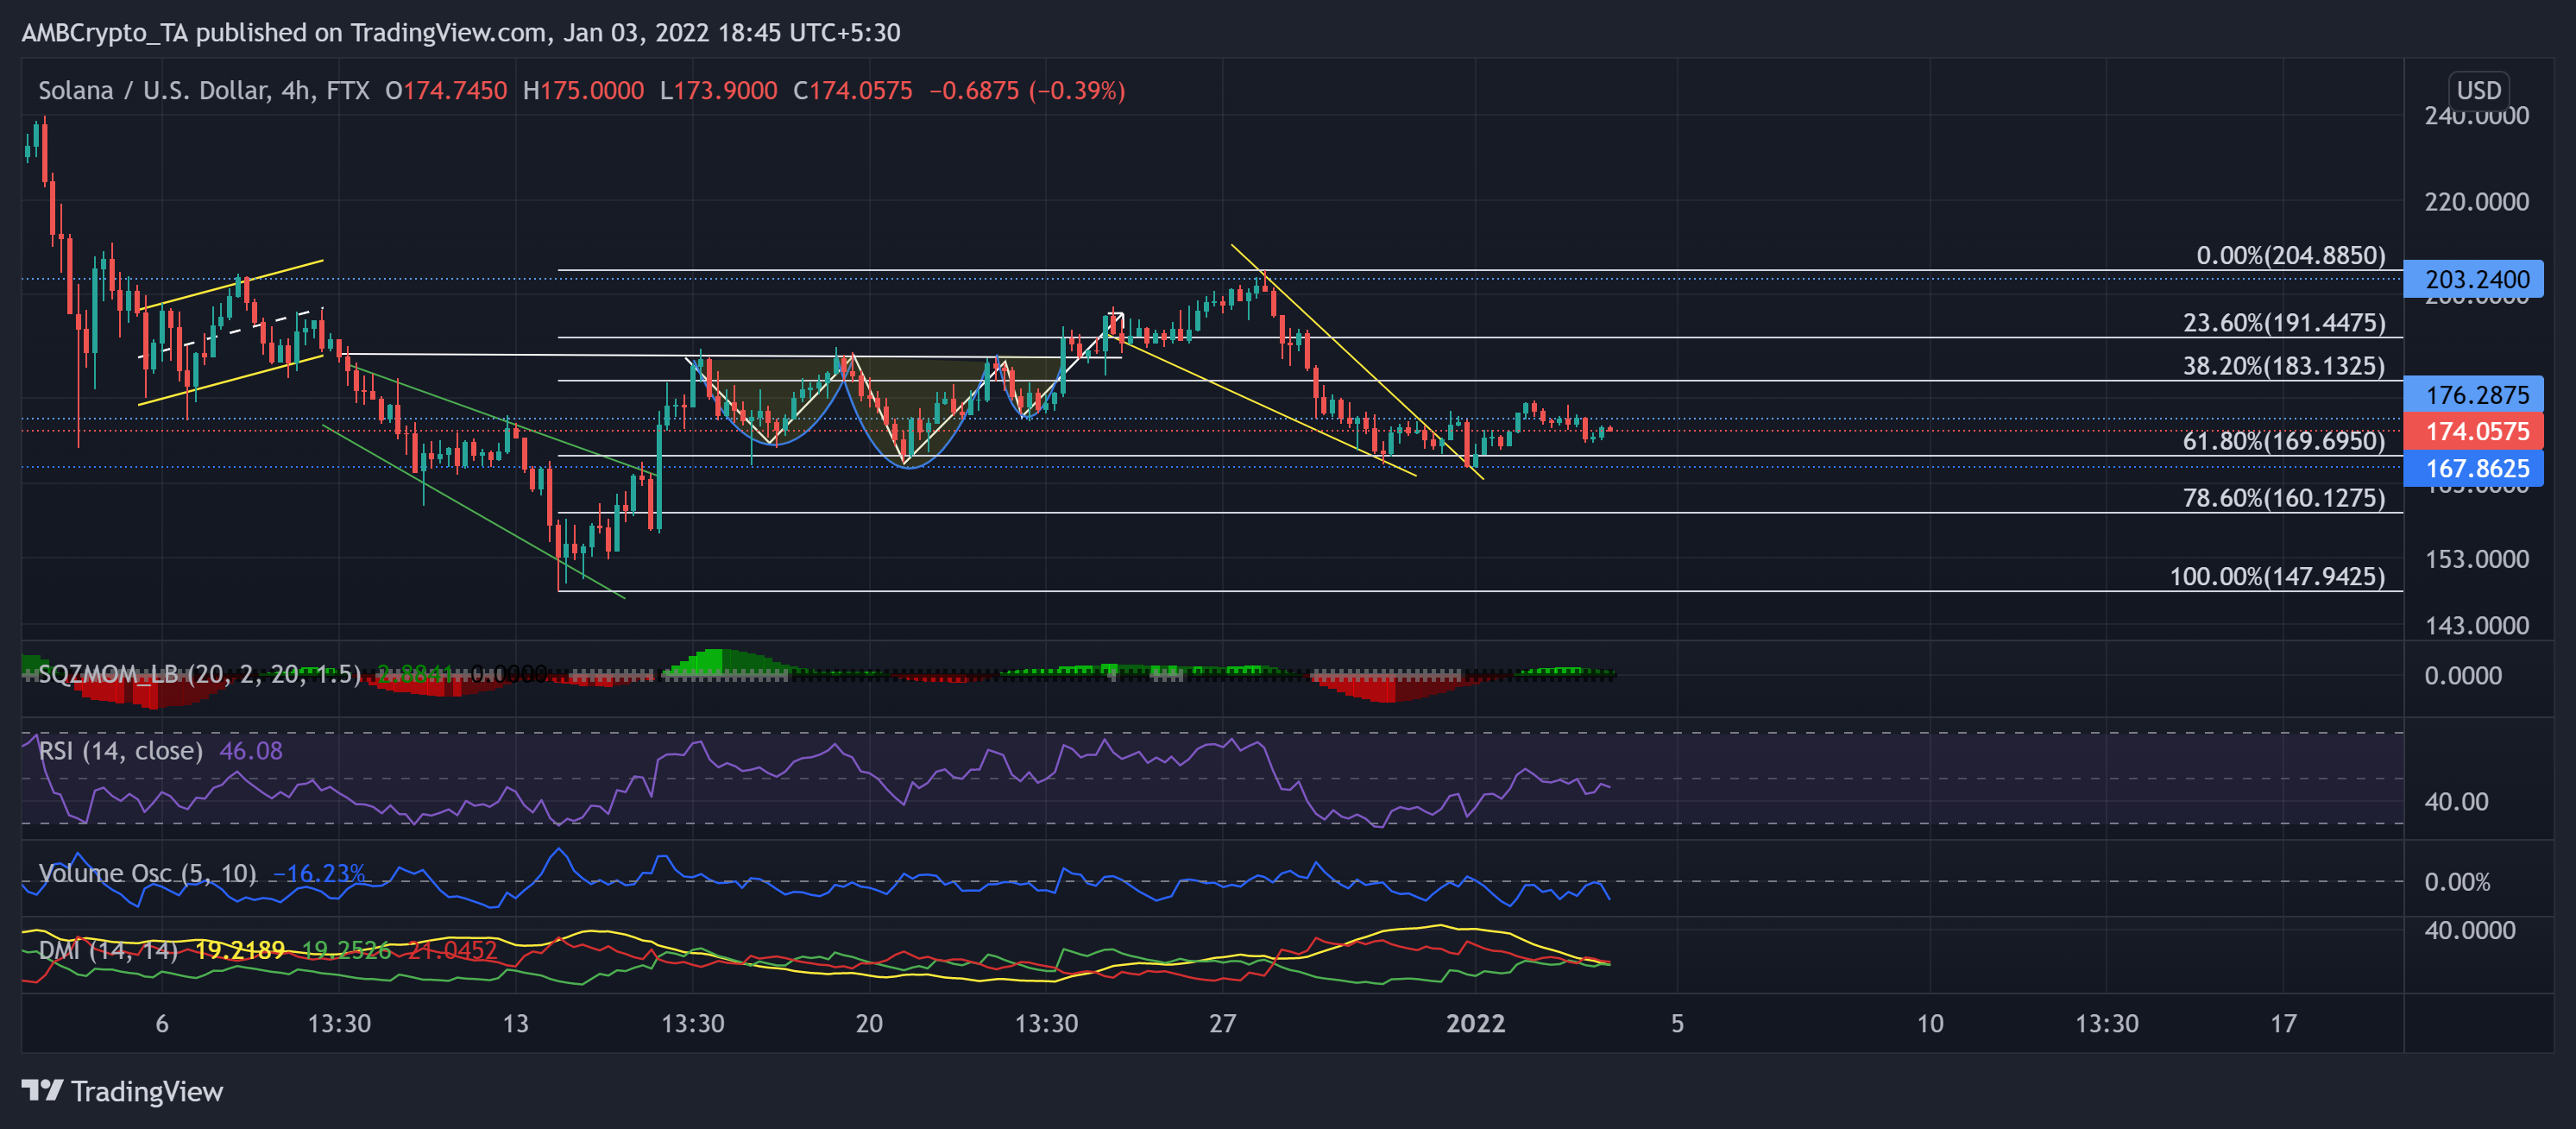
SOL continued its low volatility phase by finding an oscillation range between the $176 and $167-mark. Thus, the Squeeze Momentum Indicator still flashed black dots.
The breakout reversal on 27 December from the $203-mark found strong support at the near-term 61.8% Fibonacci support. Further, the Volume Oscillator visibly depicted that pullback was on higher volumes compared to the recovery.
At press time, the alt traded at 174.0575. The RSI was just below the half-line after failing to sustain itself above the 50-mark. Also, the DMI showed a slight bearish preference but the ADX displayed a weak directional trend.
Fantom (FTM)
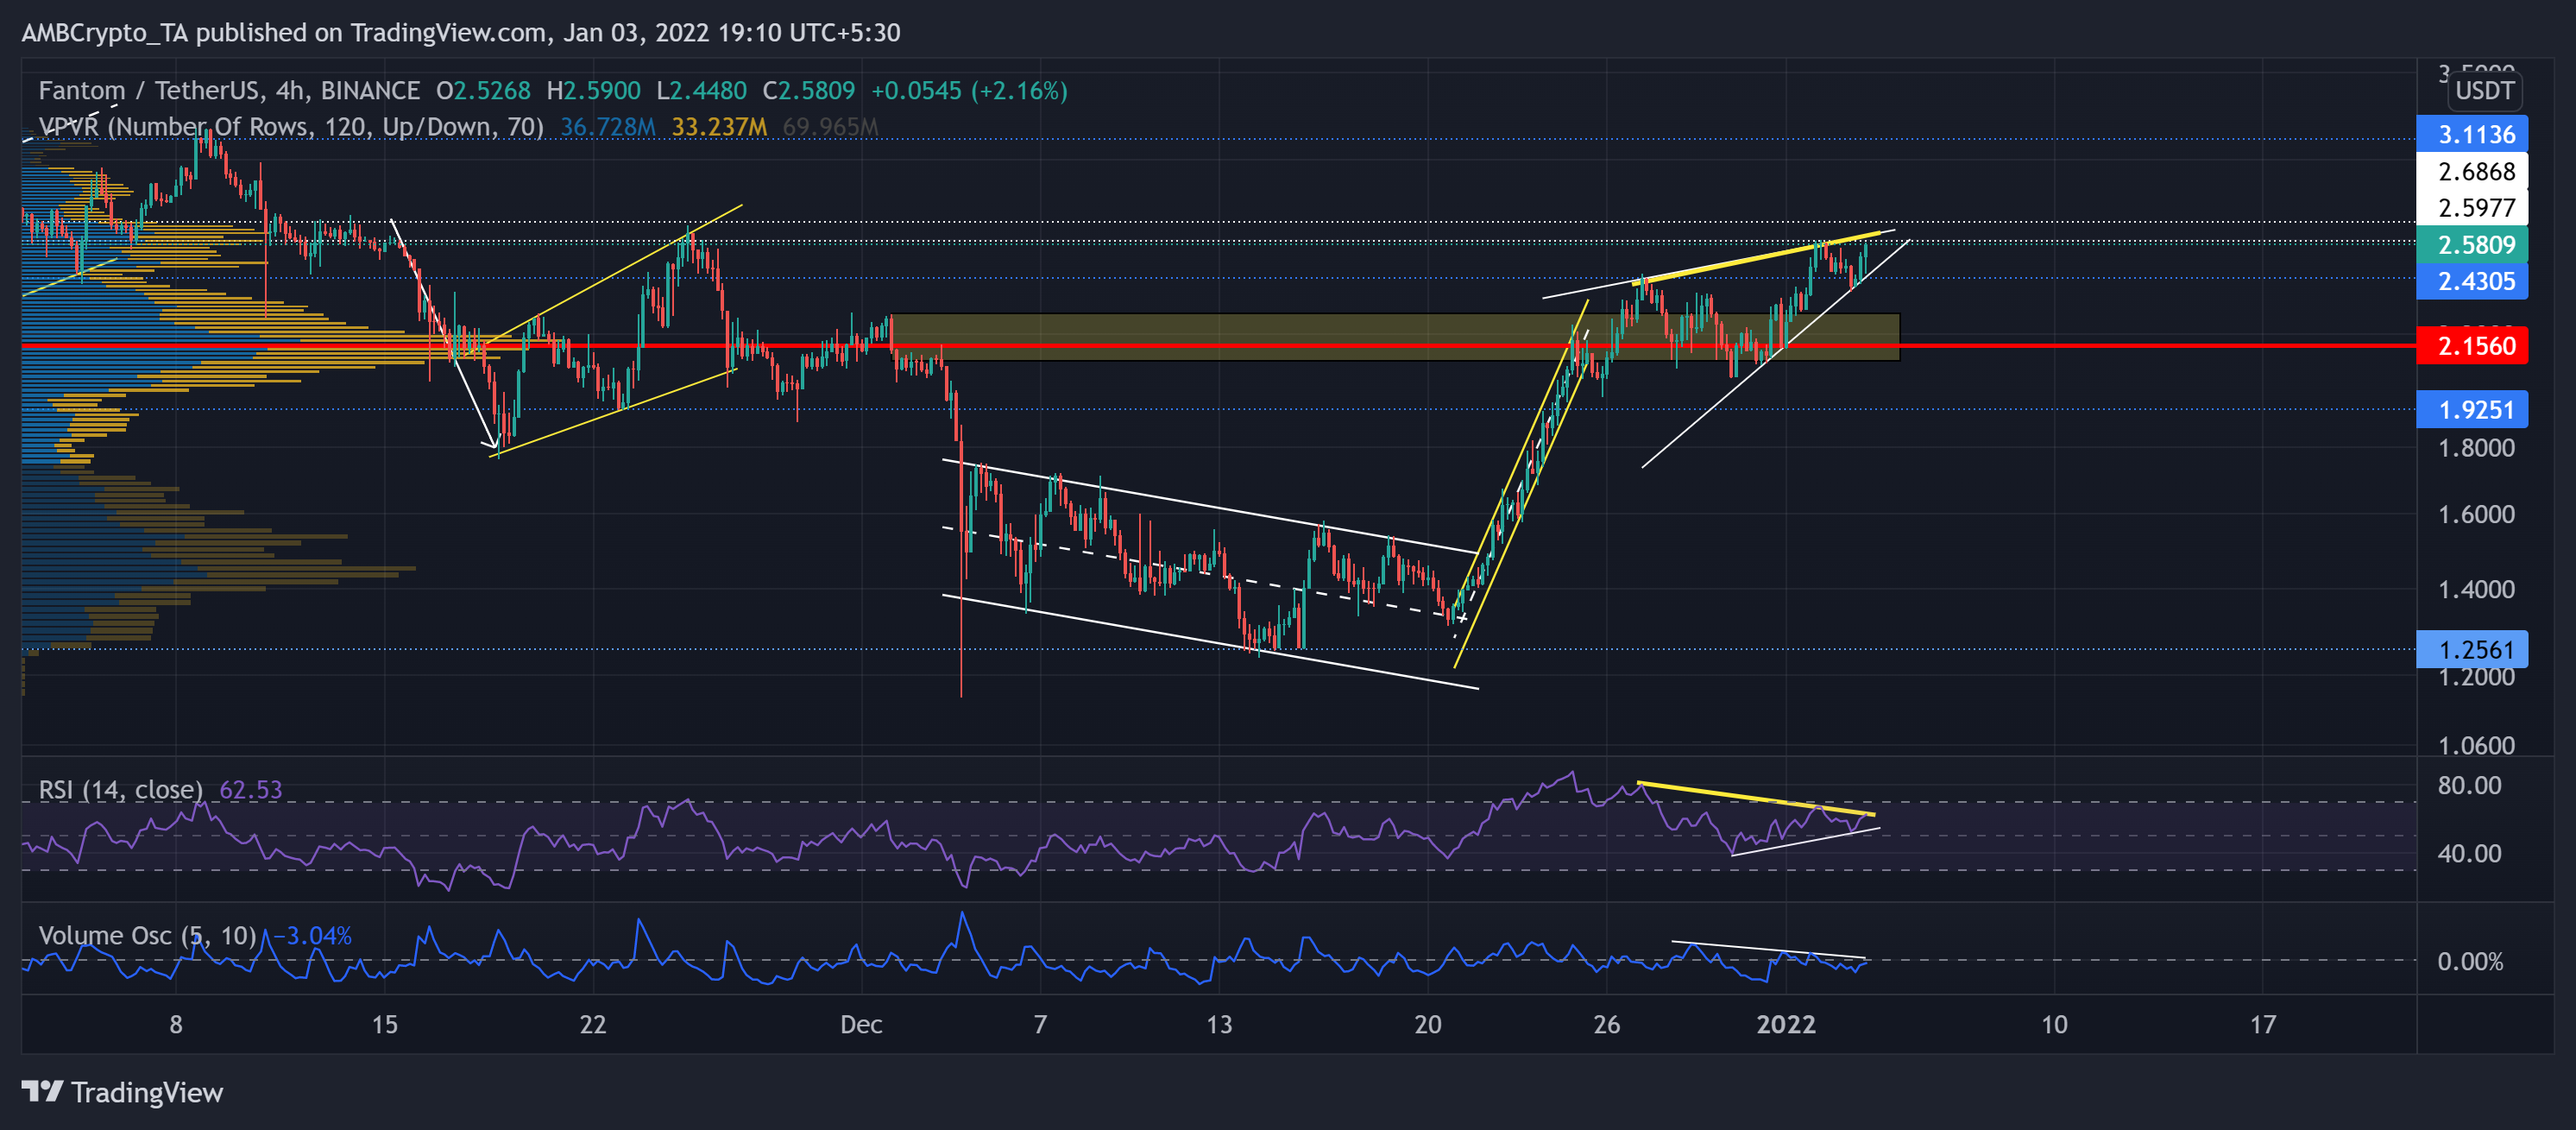
FTM witnessed a solid reversal as the price action saw an over 100% ROI (from 20 December low) until it touched its five-week high on 2 January. The ascent saw a hindrance at its previous supply zone (rectangle, yellow) that also coincided with the Point of Control (red).
The alt persistently slackened after striking its ATH on 28 October. The bulls, however, ensured the $1.25 support as it bounced back to cross the $2.4-mark (immediate support). Now, the alt formed a rising wedge (reversal pattern, white) on its 4-hour chart.
At press time, FTM traded at $2.5809. The RSI was in an uptrend while it stood at the 62-mark. However, a bearish divergence (yellow) occurred between the price action and the RSI, hinting at a possible near-term reversal. Also, the Volume Oscillator marked lower peaks, indicating a weak bullish move.