AVAX enters consolidation zone in triangle pattern: Is it ripe for a bullish breakout

AVAX kicked off April on a correction phase which saw it dip from its recent local high of $104 to its current price at $83. Its price action for the last 10 days was underscored by a descending resistance line and an ascending support level. The resulting triangle pattern and the price squeeze mean a breakout is imminent.
AVAX maintained an overall bullish performance from mid-March when it rallied from $70 price levels and managed to cross above $100, albeit briefly between 30 March and 2 April. It has since lost some of its gains courtesy of the ongoing correction phase which echoes the overall market sentiment. AVAX’s 4-hour chart reveals that the correction phase has been trading within a wedge pattern which is now entering a breakout zone.
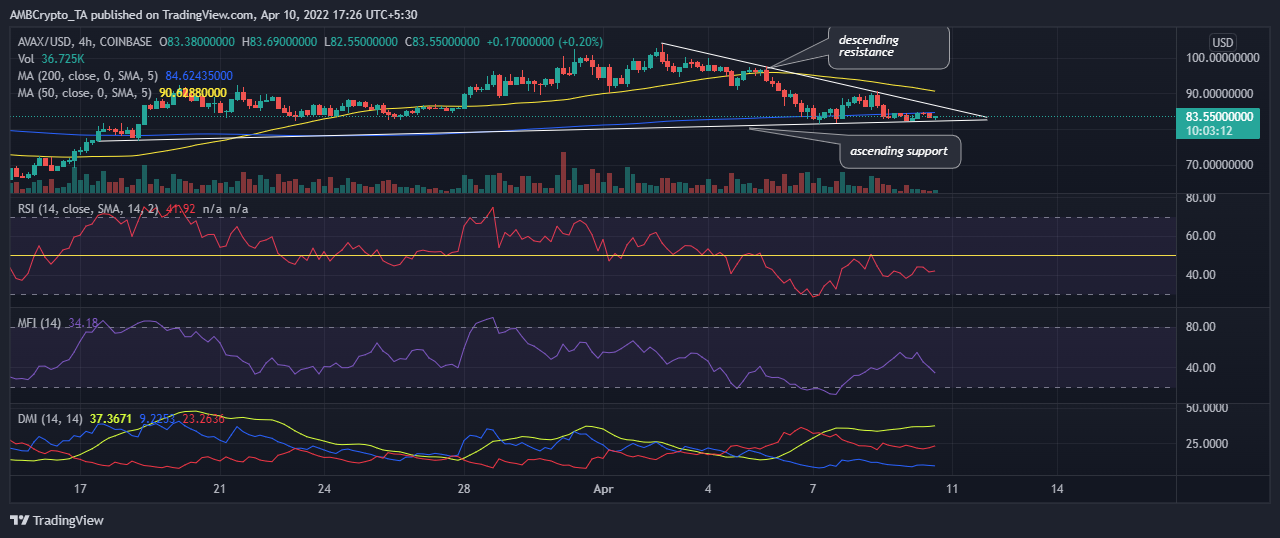
The above chart demonstrates that the support and resistance lines are currently pushing AVAX into a narrow consolidation zone where it is preparing for a breakout on either side. Its price action bounced from the support level within the hour at the time of this press, confirming the pattern.
Its RSI indicator has been hovering below 50 for the last two days but it still has some way to go before it enters the oversold zone. The MFI indicator shows significant outflows between 9 and 10 April, although it currently shows an uptick after the price briefly touched the support line. The MFI currently confirms that the price is still in a strong bearish trend. Hence, the price action has been localized near the support level than the descending resistance line.
AVAX’s on-chain metrics
AVAX’s weekly trading volume and market price have been on a downward trajectory, aligning with bearish price action during the same period. Its development activity metric highlights increased activity from the start of the month, peaking on 7 April, before tapering out. The cryptocurrency’s weighted sentiment metric is currently at its lowest weekly level.

Where is AVAX headed?
AVAX’s current price correction is down by almost 20% from its recent top and it is possible for the bears to give way to a topside breakout. However, there is also the possibility of a breakout which would likely push the price to the oversold conditions especially if it extends the correction to more than 30%.


