AVAX is expected to have a hard time recovering thanks to…

Disclaimer: The findings of the following analysis are the sole opinions of the writer and should not be considered investment advice
Avalanche has a market capitalization of $31.5 billion and stands tenth on CMC, ranked according to market cap. Since February, the price has traded within a range, and at press time, it appears to have met some resistance at a bearish breaker at $82. On-chain as well, investor activity in terms of unique daily depositors on the Avalanche bridge has been dropping in recent months. TVL took a tumble and it appeared that fear could be resurgent in the markets once more.
AVAX- 12 Hour Chart
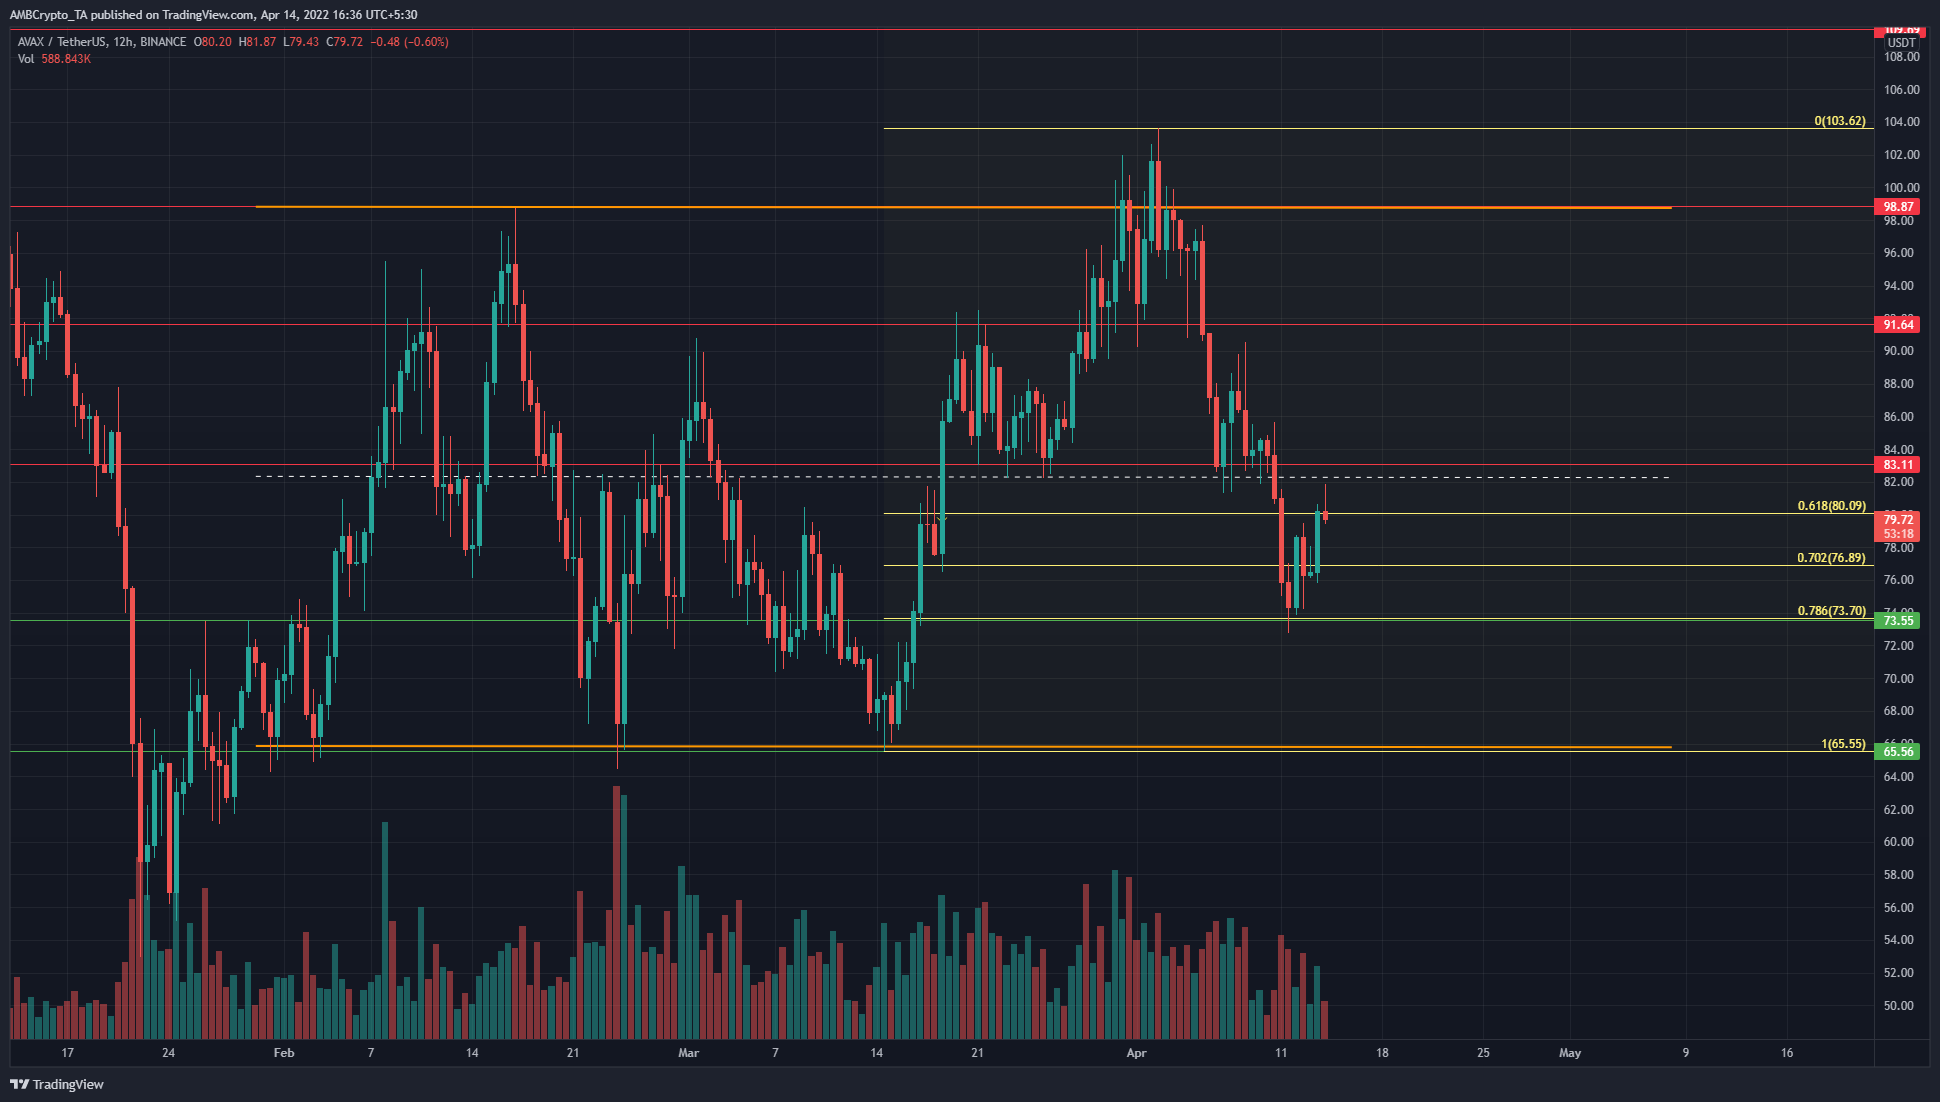
A bearish breaker was spotted at $82. In the past few weeks, this level had acted as support but in April, the price plunged lower to find support at $73. Therefore, it demarcated the $81-$83 area as a place for the price to revisit to collect liquidity and confirm a shift in market structure toward the bearish side.
Moreover, consider the range (orange) that Avalanche has established between $65.8 and $98.8. The mid-point of this lies at $82 and is a significant level of resistance. Along with the prior bearish breaker, it is logical that the bulls see rejection in the $82 area.
A set of Fibonacci levels were plotted based on AVAX’s move from the range lows at $65.5 to the local highs at $103.62, and the 78.6% retracement level has been respected. However, it might not hold on another retest.
Rationale
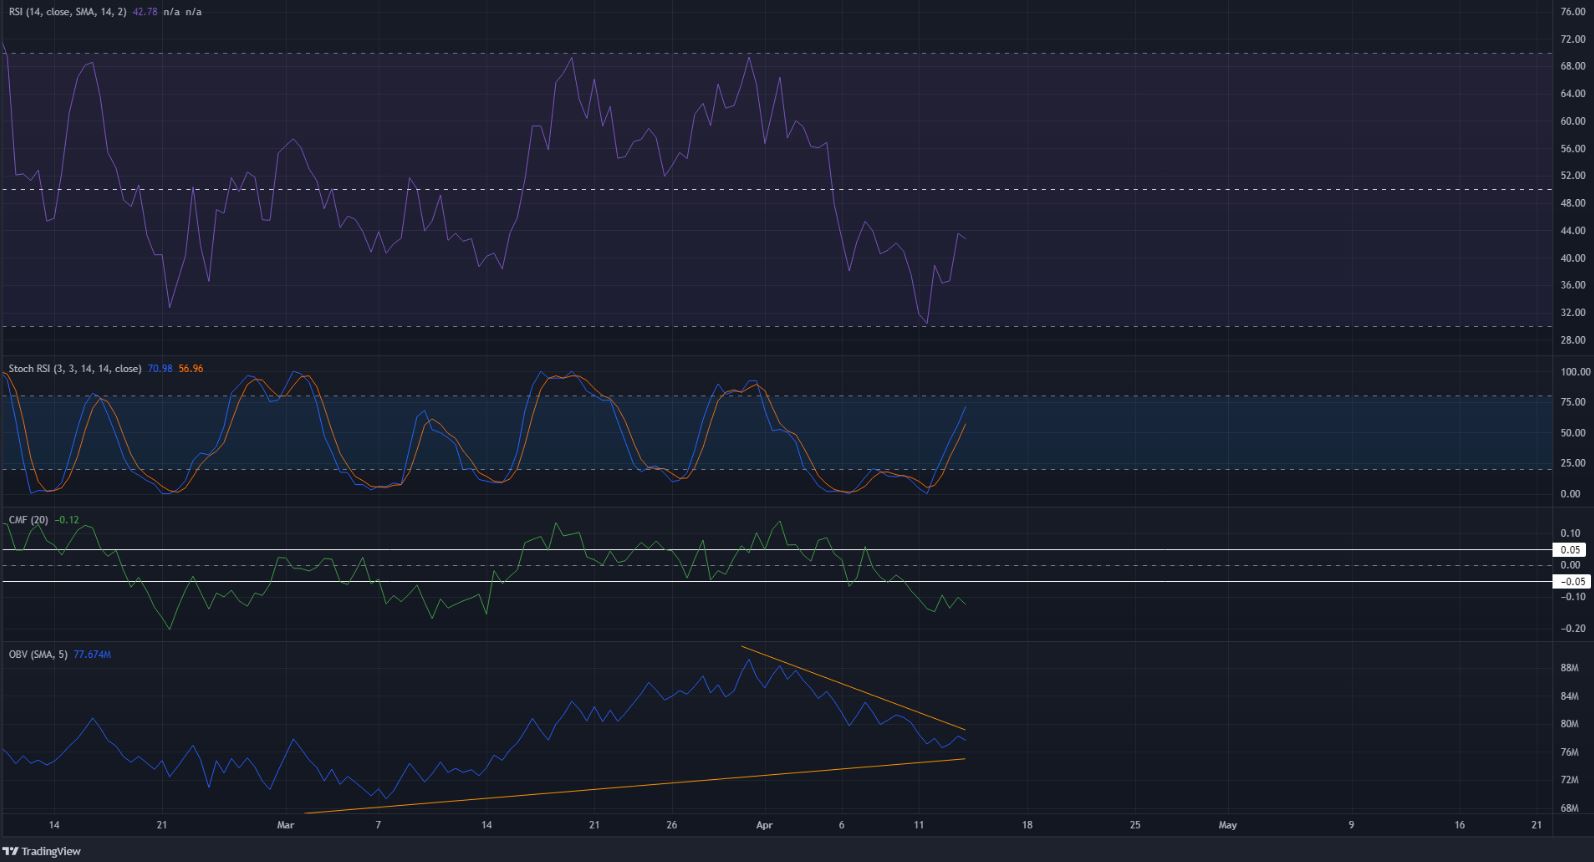
The RSI was unable to climb past the neutral 50 line, in fact, it appeared to have lost steam at the 44 mark and was headed lower. The Stochastic RSI was also headed steeply upward. The Chaikin Money Flow continued to stay beneath the -0.05 level to show strong selling pressure.
Together, the indicators and price action meant that another visit to the $81-$83 level in the next couple of days would likely be a selling opportunity.
The OBV formed higher lows in the previous month and saw a dip as the price also saw a pullback from the $100 area. This showed that buying volume has been steady in the past month, but did not spell an end to the pullback from $100 yet.
Conclusion
The OBV showed buyers still had some effect on the direction of AVAX’s price in the next few weeks. The price action and the momentum indicators, on the other hand, signaled that a move southward to $65-$68 could be imminent.