AVAX sees a gap on the price charts, is this where selling pressure could step in
Disclaimer: The information presented does not constitute financial, investment, trading, or other types of advice and is solely the writer’s opinion.
- Inefficiency on the price charts was spotted, but will it get filled?
- The higher timeframe bias remains bearish
Bitcoin [BTC] found some solid footing at the $18.6k mark and managed to hold on to the $19k level over the past few days. In October, BTC refused to close a daily session below the $19k mark. Was this a show of strength from the stubborn bulls? Avalanche [AVAX], on the other hand, had a more bearish outlook.
Here’s AMBCrypto’s Price Prediction for Avalanche [AVAX] in 2022
The longer-term trend has been downward since August, and important levels of support were breached on the way down. At the time of writing, yet another selling opportunity was brewing for AVAX.
Inefficient at $16.5- time to go short?
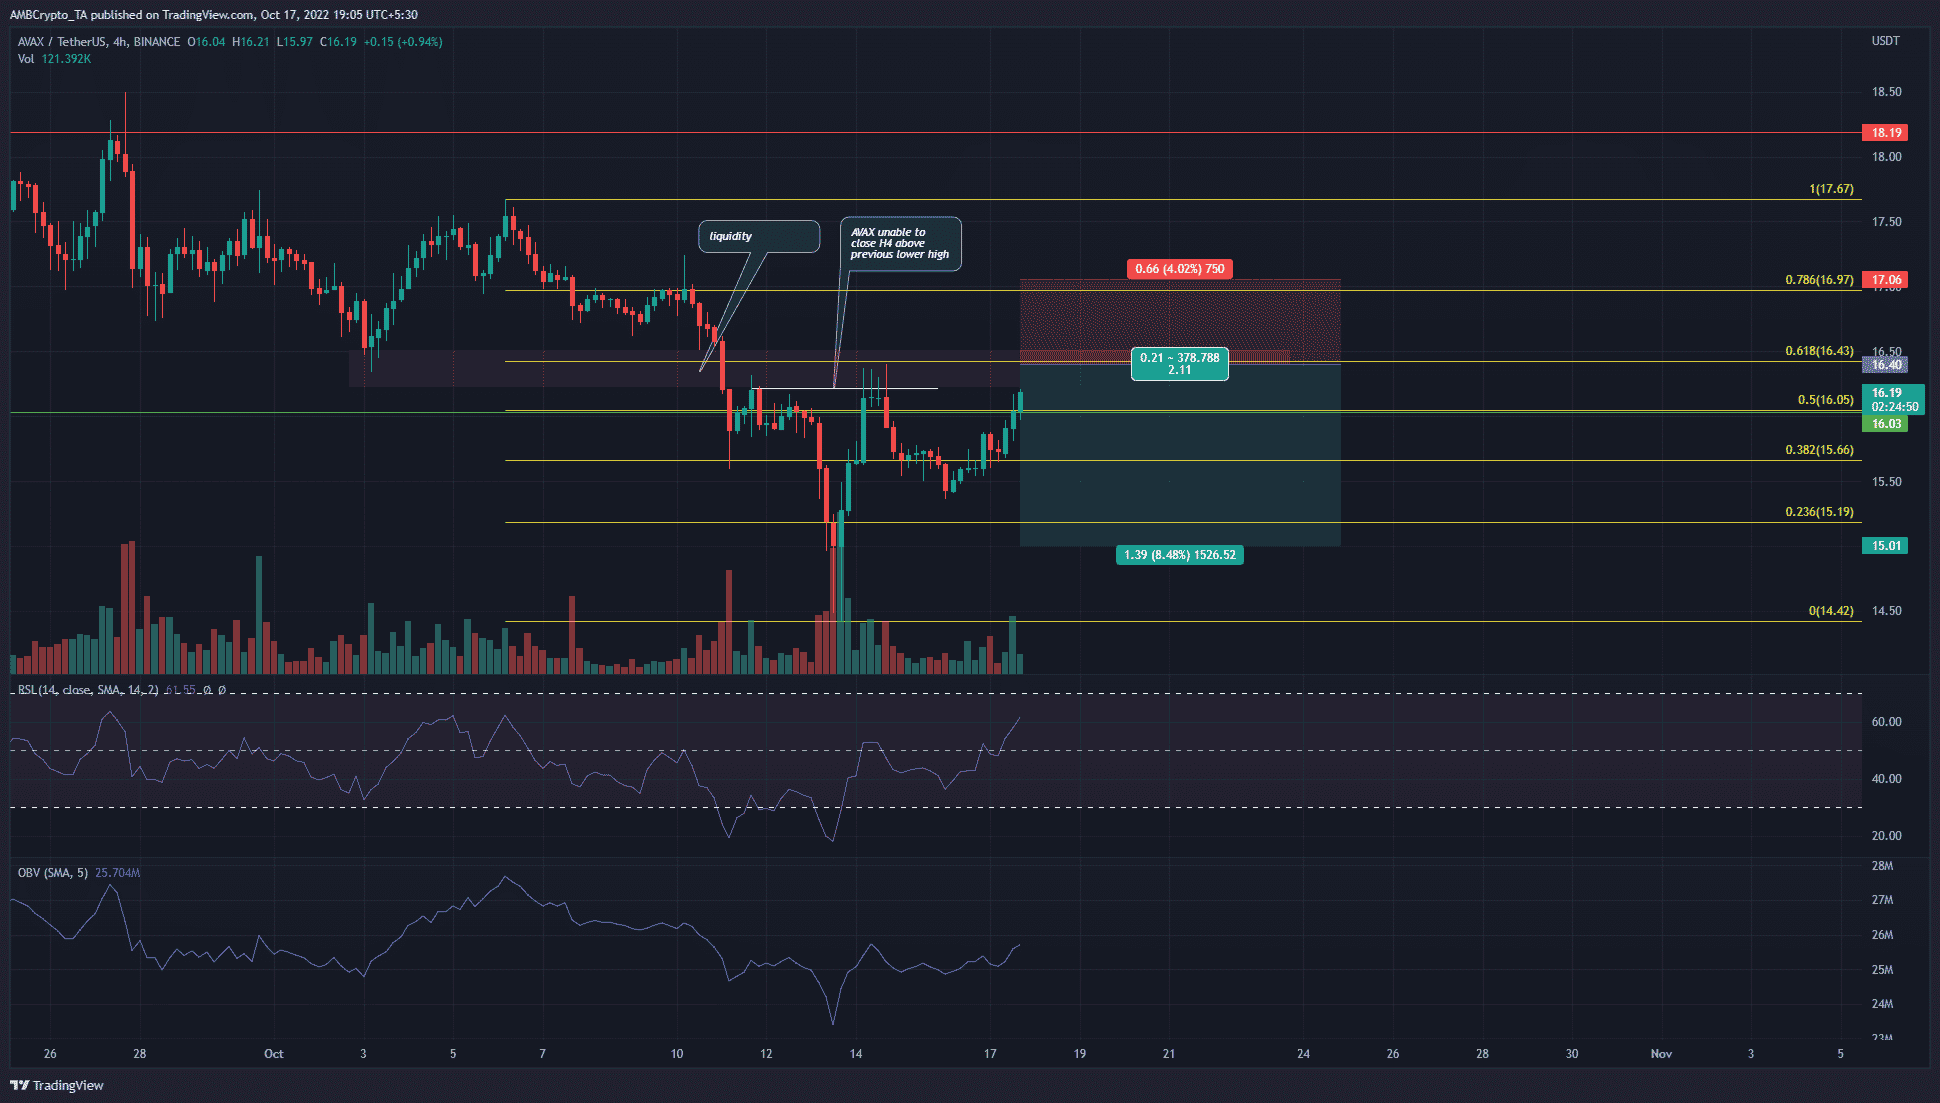
The move down from $16.97 to touch $14.42 was quite steep. The sharp plunge downward on the price charts saw the $16.4-$16.5 zone go without a retest on the way down. Such a gap sometimes has a tendency to get filled before a resumption of the former trend.
In this case, the higher timeframe trend was bearish. Moreover, in October, the $16.4 region has seen multiple candle wicks which saw a strong price move away. This meant that there was significant liquidity in this region.
Short sellers of the past week are likely to have set their stop losses just above the recent local high at $16.43. Therefore, a stop-loss hunt to this territory could materialize over the next few hours. Traders can look to enter near this region and target another leg downward.
Invalidation of this bearish idea would be a session close above $17. A move above $16.6, by itself, would signal short-term bullishness. A move above $16.9-$17 would flip the higher timeframe structure to bullish.
Social Dominance near three-month low
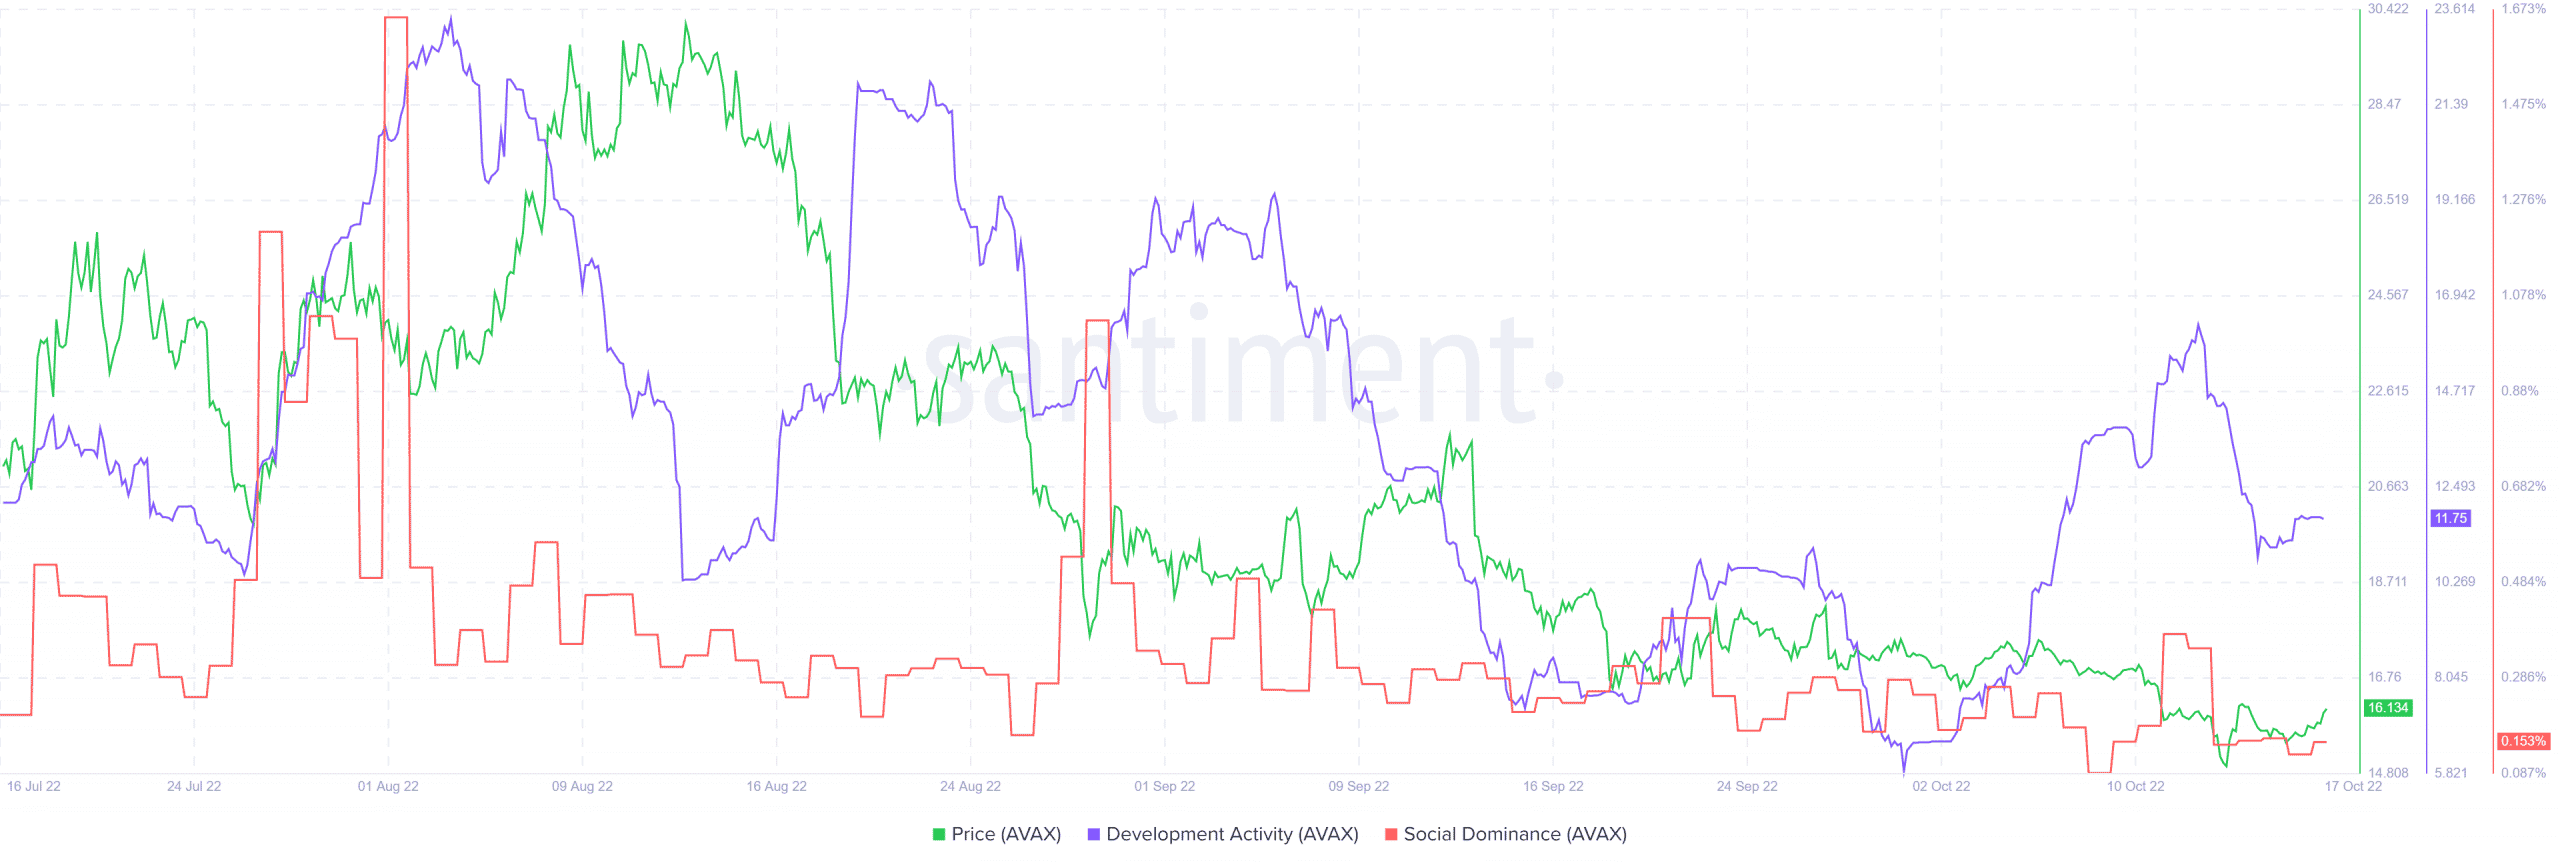
The falling social dominance metric indicated that Avalanche was losing ground in the popularity battle. It fell to its lowest level at 0.08% earlier this month, which was well below the 0.17% floor that AVAX had established since late August.
On the other hand, the development activity was on the rise in the past two weeks. This was a good sign for investors who want to make sure the developers are constantly making the network better.
The price prediction bot painted a bearish picture for Avalanche in 2022. Technical analysis showed the daily timeframe to be in a downtrend as well. If Bitcoin witnessed a sharp move lower over the next few days, it could drag Avalanche south as well.