AXS now well-positioned to eye this price level if one scenario plays out

Disclaimer: The findings of the following analysis are the sole opinions of the writer and should not be considered investment advice
After hitting its ATH on 6 November, Axie Infinity (AXS) commenced its downturn in a descending channel while the bears kept testing the crucial $46-support.
Assuming the bulls can uphold this support, as they have for over six months, a patterned breakout towards the $54-mark before entering into a tight phase seems likely. But, any close below the 78.6% Fibonacci support would contribute to a $43-retest before picking itself up towards the mean of Bollinger Bands (BB).
At press time, AXS was trading at $48.4, down by 2.2% in the last 24 hours.
AXS Daily Chart
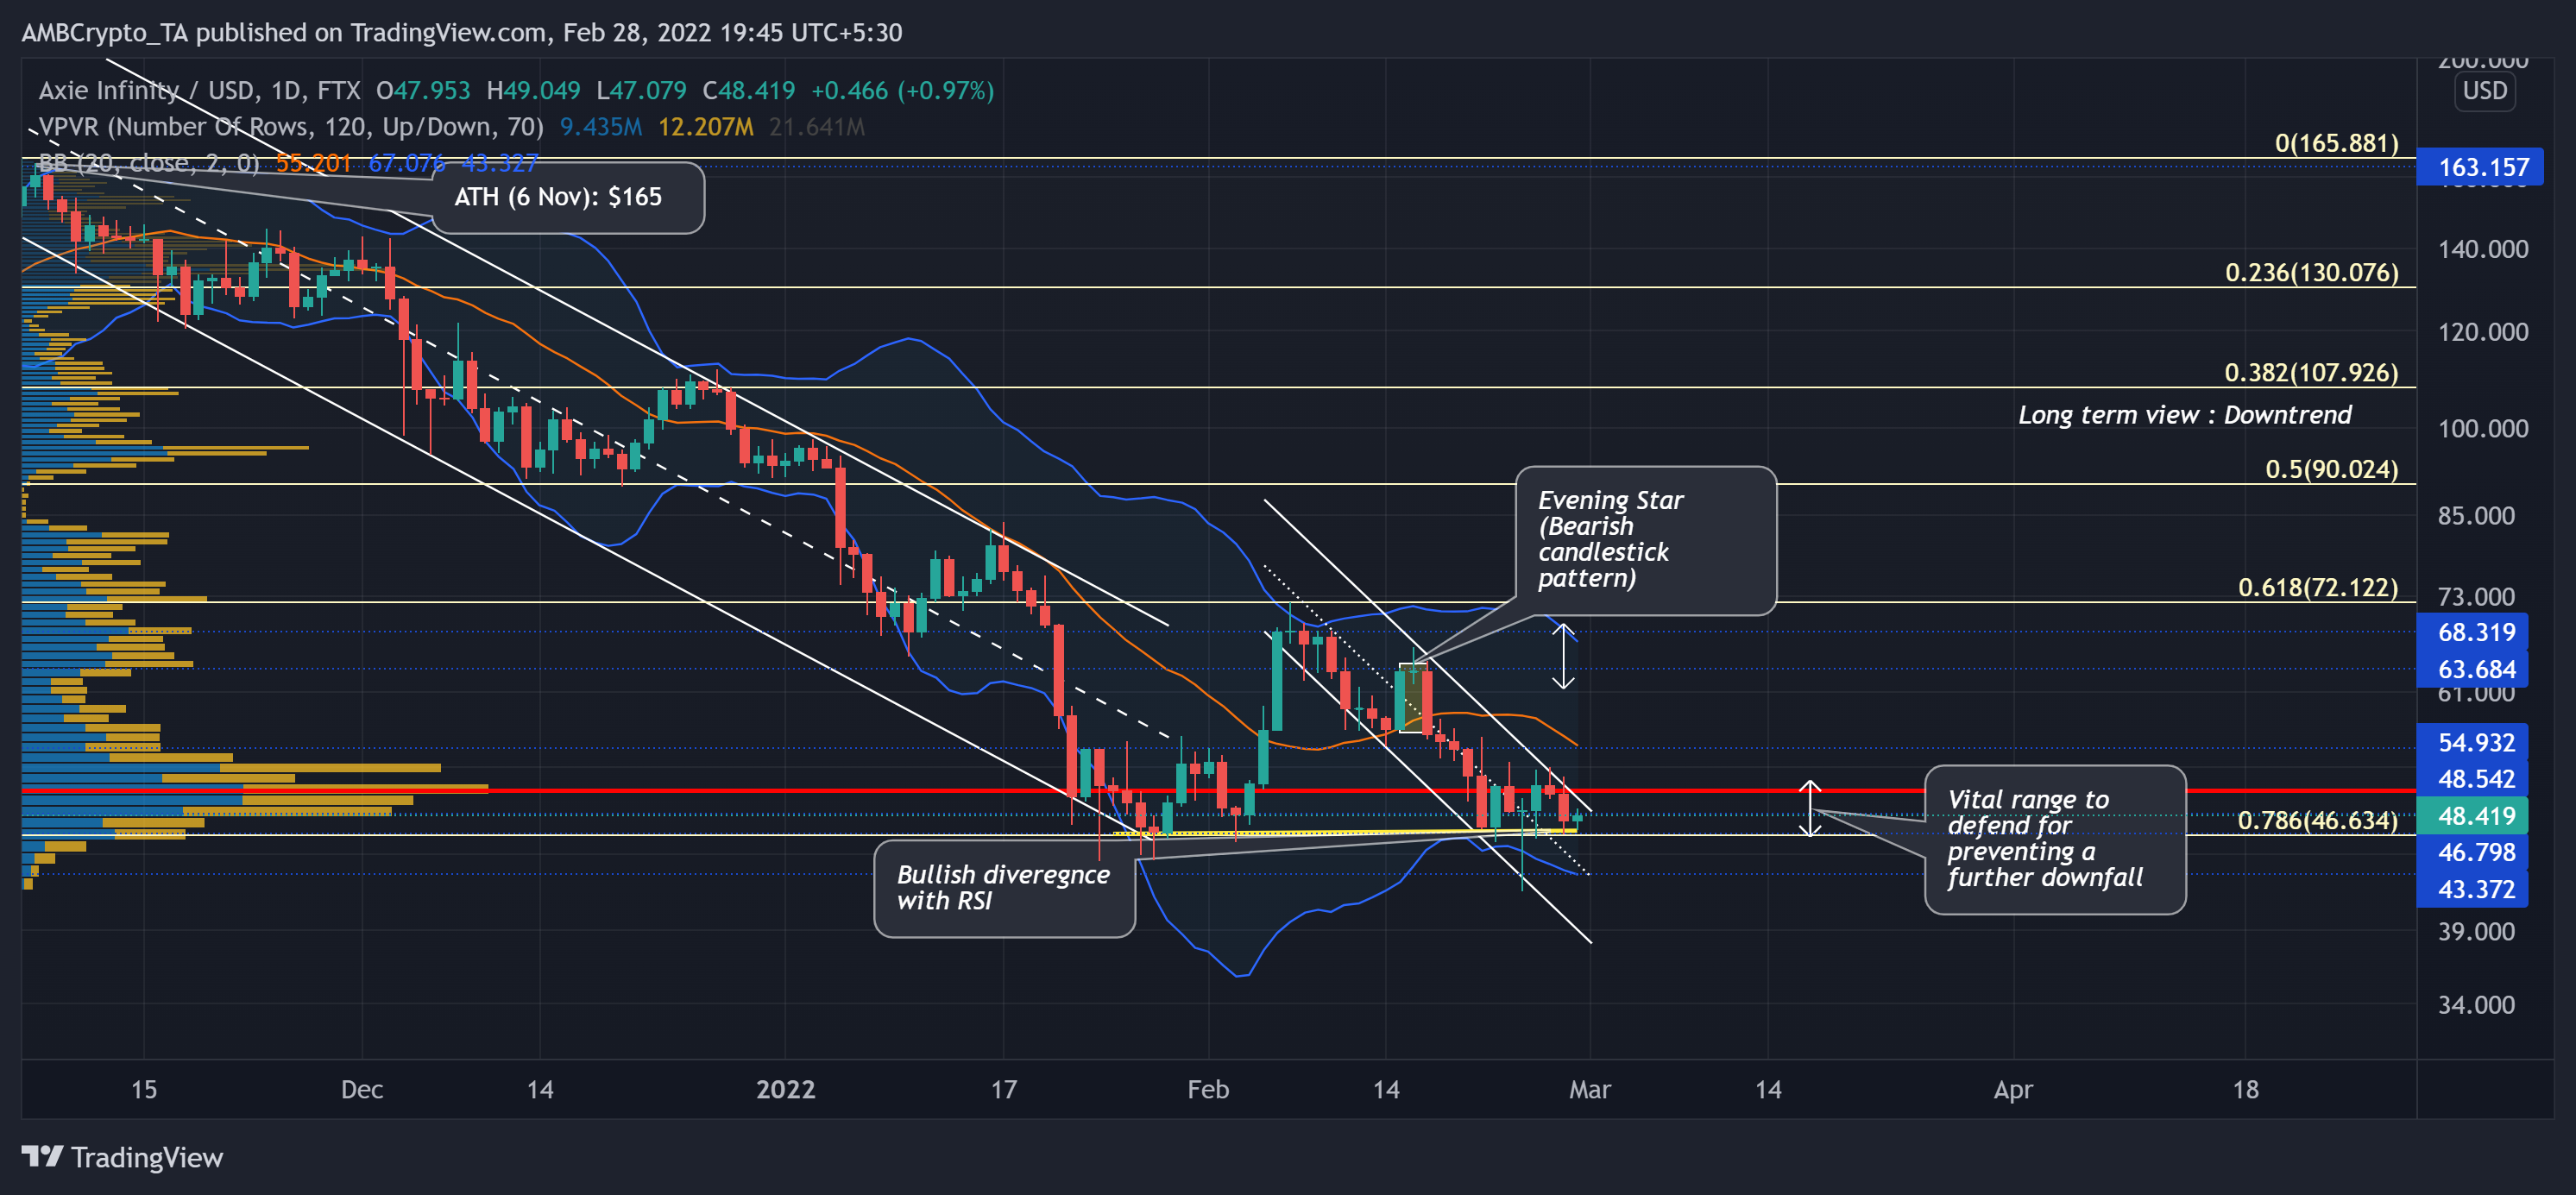
The retracement phase marked a couple of down channels (white) on its daily chart as the alt lost nearly 74.4% of its value (Since 6 November) and touched its six-month low on 24 February. As a result, AXS struggled to float above the mean of its BB.
Due to this trajectory, AXS lost the vital 61.8% Fibonacci level and the crucial Point of Control (red) near the $50-mark. The fall halted at the 78.6% Fibonacci level. The bears are keen on breaching this level while the bulls refrain from giving further control. Thus, creating a strong clash between the buyers and sellers in the $46-$50 range.
Should the buyers fail to defend this range, a potential retest of the lower band of BB would be likely before a bullish resurgence. Besides, considering its historical behaviour, the bulls could propel a revival and endeavour to close above the Point of Control (POC, red). In either case, considering the uptrend of its RSI, there is potential for a likely test of the $54-zone.
Rationale
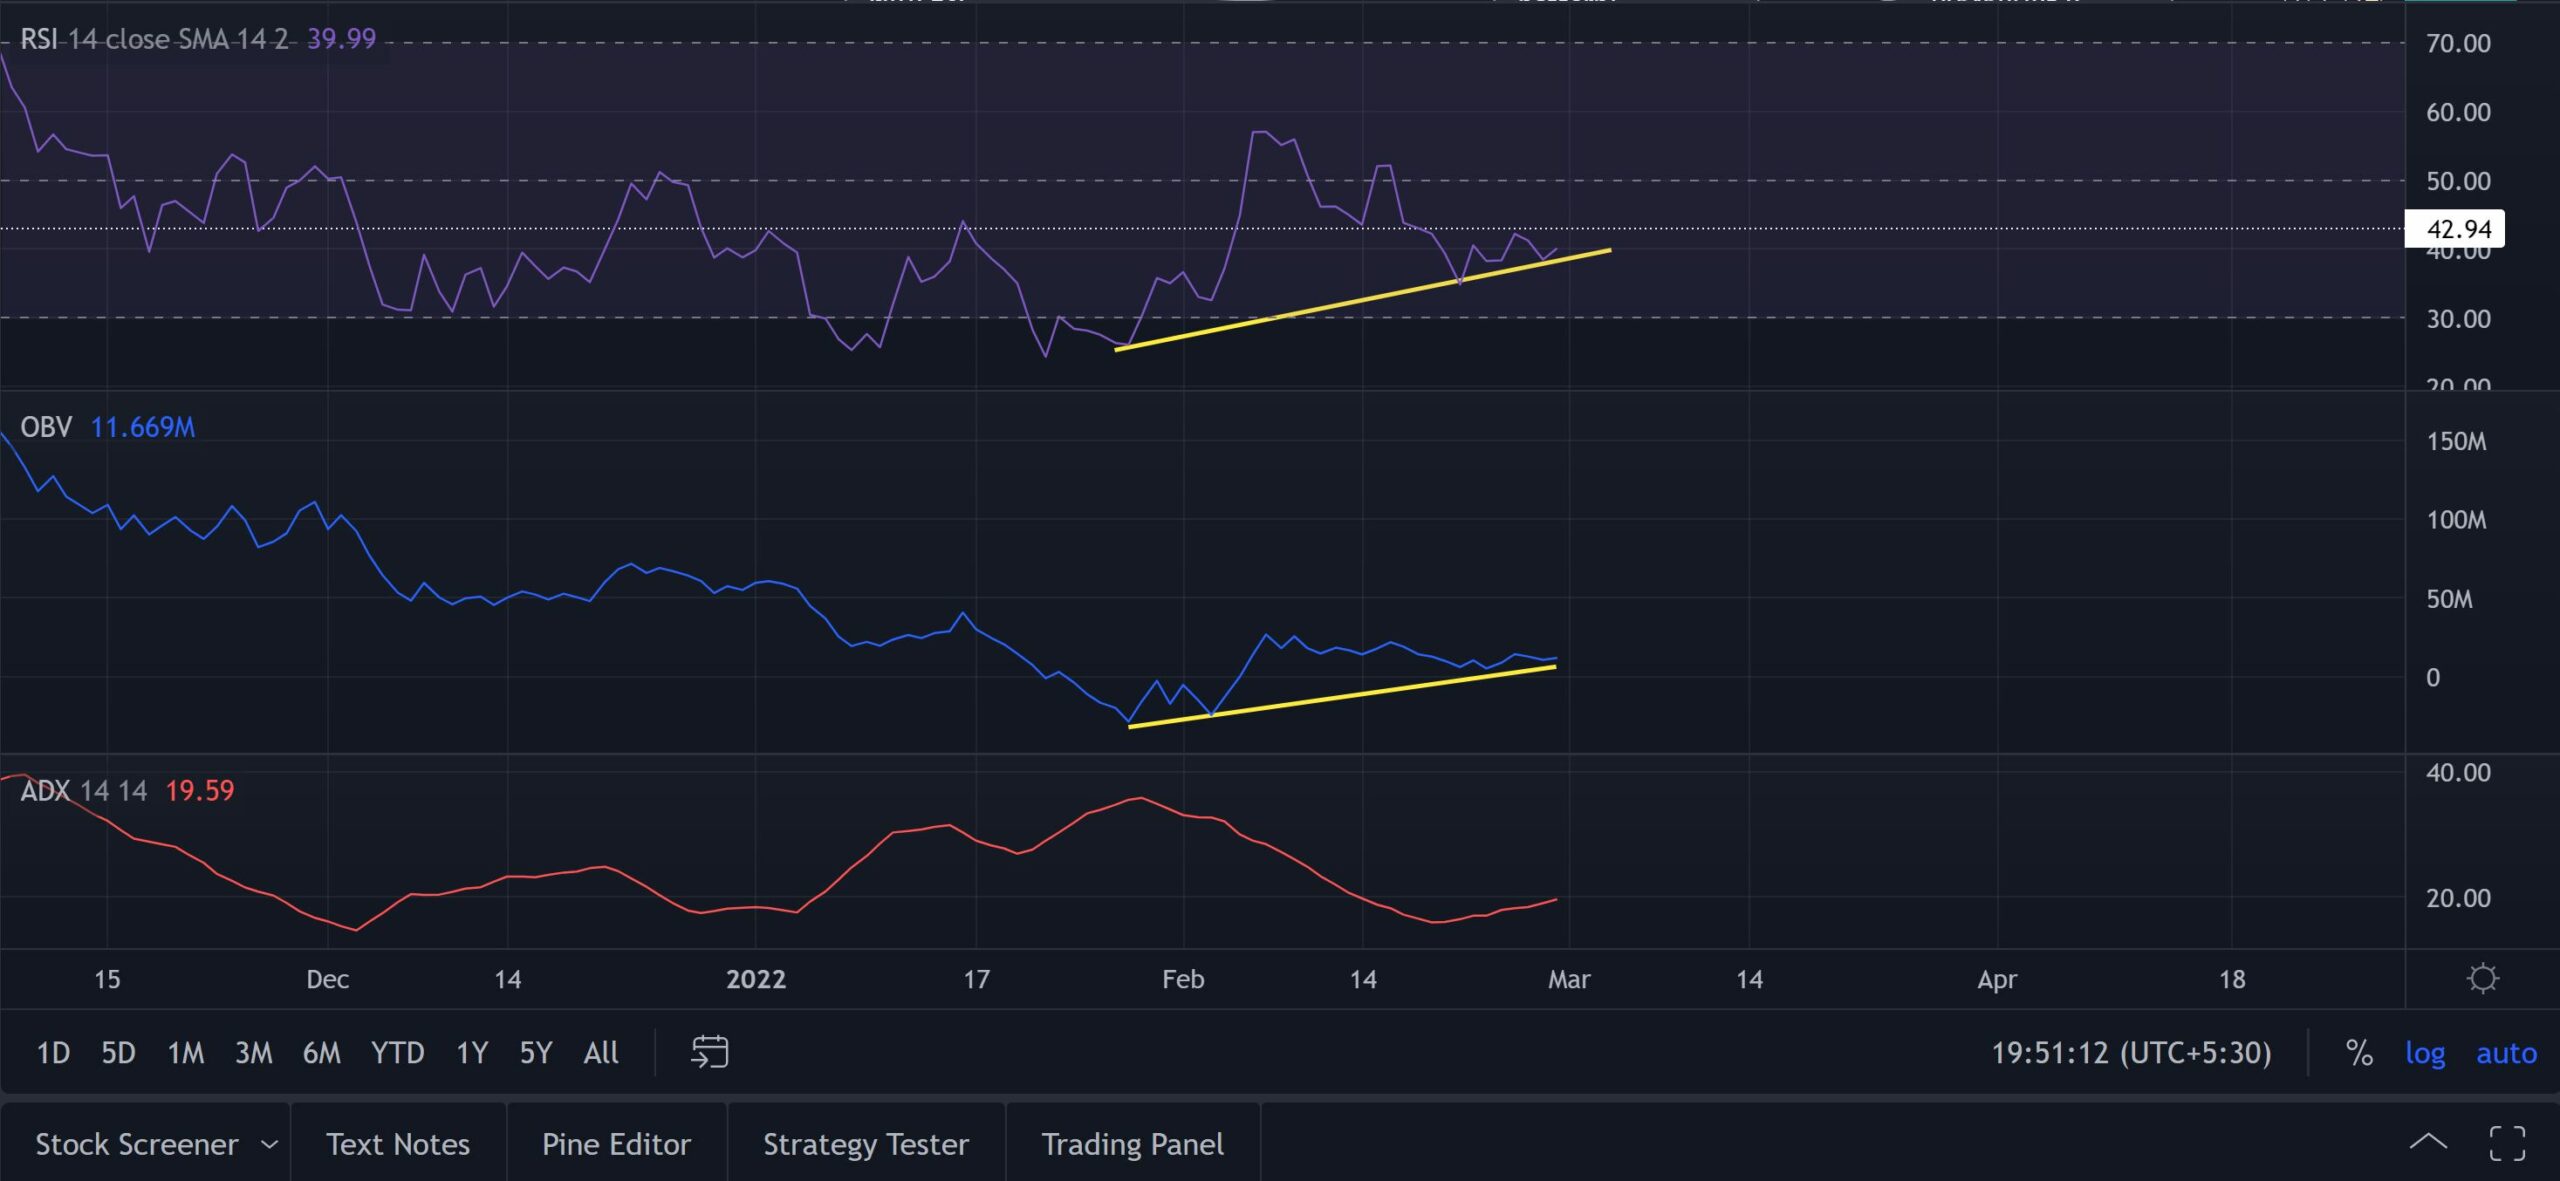
For the past month, the RSI marked higher troughs while AXS kept testing the $46-support level. This trajectory revealed the existence of a potential bullish divergence as the buyers try to build up pressure.
Furthermore, the OBV reaffirmed this reading by conforming to the monthly uptrend. Having said that, the ADX still needs to improve its position and display a strong directional trend to affirm a solid recovery.
Conclusion
Considering the underlying increase in the buying pressure as depicted by the RSI and OBV, a likely break above the POC would position the alt for the test of the mean of its BB. A close below the 78.6% support would propel a further downfall before a revival to the aforesaid level.
Besides, the alt shares a staggering 91% 30-day correlation with Bitcoin. Hence, keeping an eye on Bitcoin’s movement along with the overall market sentiment would be essential towards making a profitable move.