AXS shows some short-term strength but a resolute resistance zone looms ahead

Disclaimer: The findings of the following analysis are the sole opinions of the writer and should not be considered investment advice.
Bitcoin [BTC] wobbled between $20k and $19.9k in the twelve hours preceding press time. It has failed to recapture the $20.4k-$20.5k region as support in the past few days. The short-term bias for Bitcoin was bearish, and a revisit of the $19.2k mark could materialize.
Despite this backdrop, Axie Infinity [AXS] had some upward momentum and looked likely to register some gains in the coming hours. Caution was advisable and a risk-averse trader could wait for AXS to reach resistance to short the asset rather than entering a long position.
AXS- 1-Hour Chart
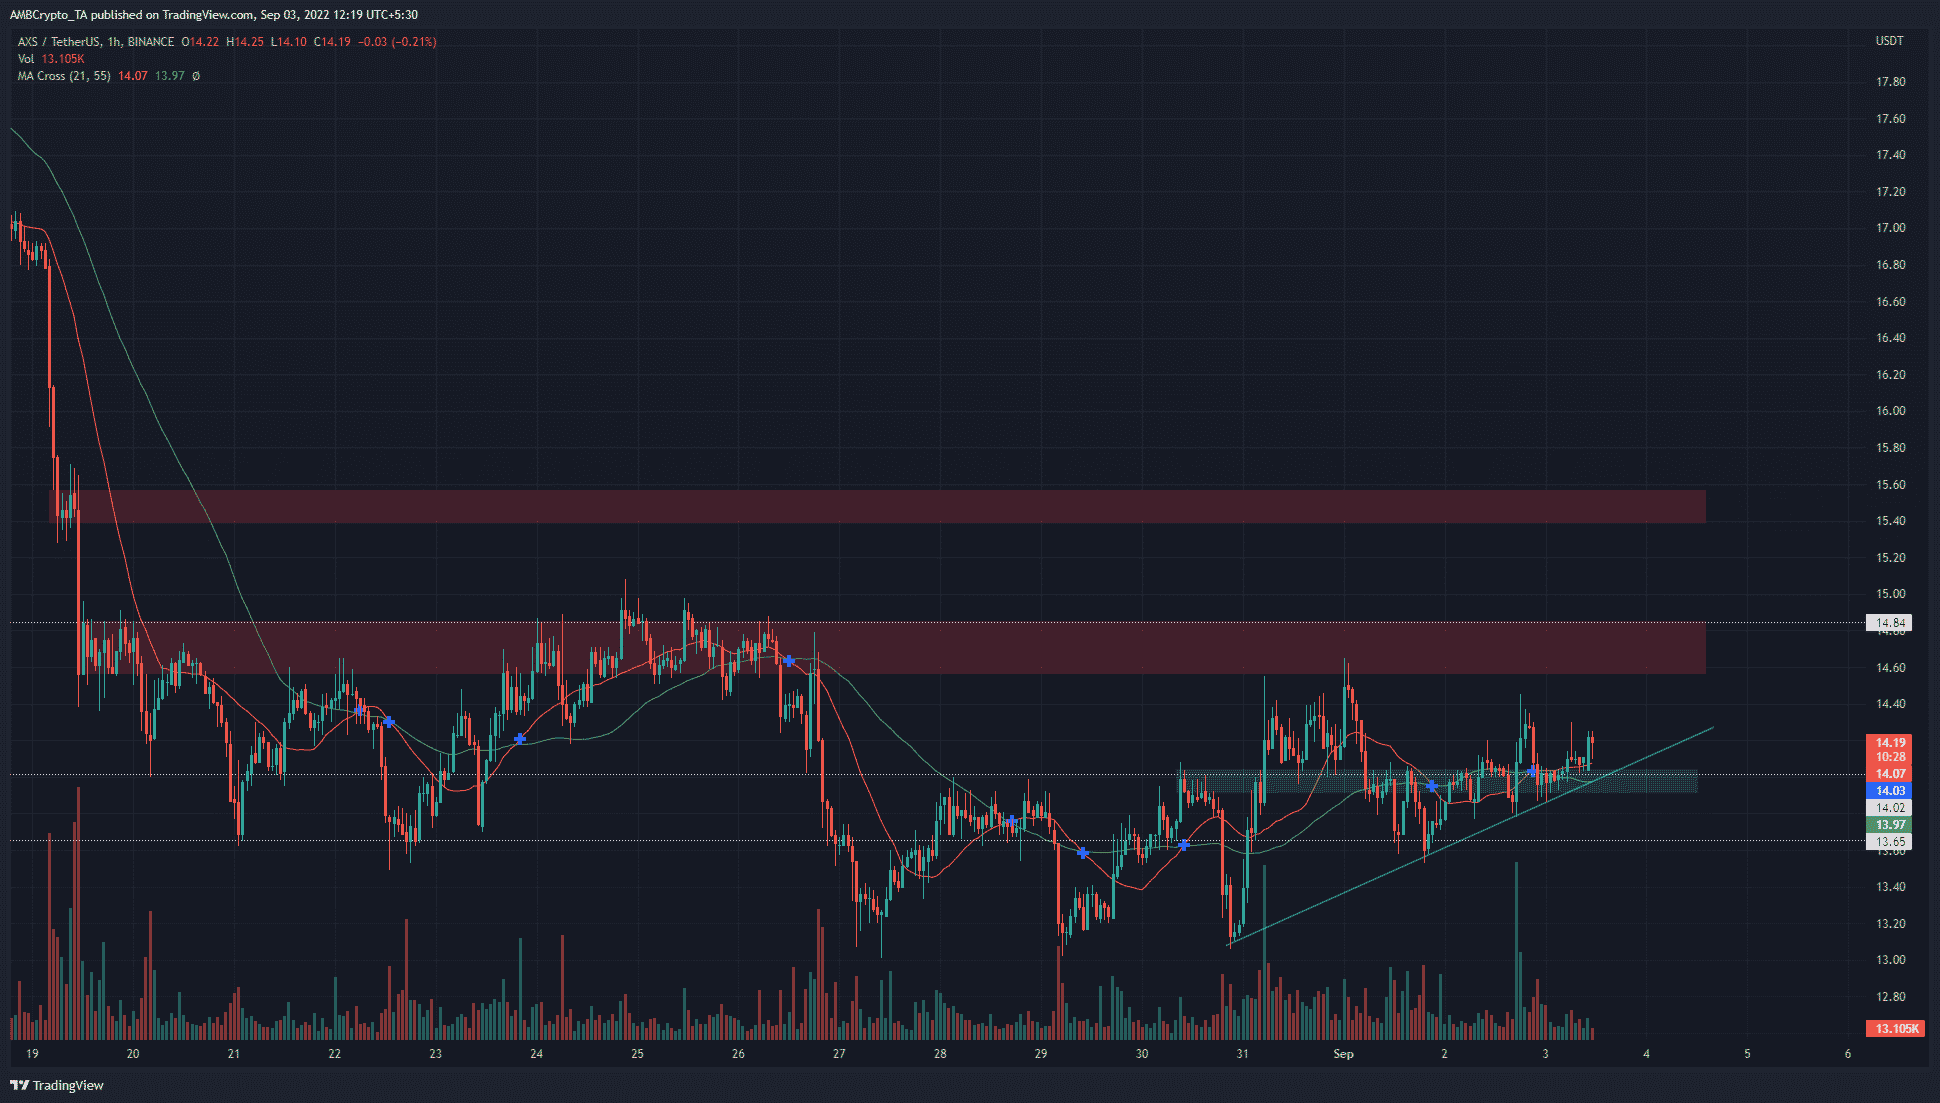
The one-hour chart showed a significant amount of volatility in the past few weeks. For the most part of the past two weeks, AXS has traded between the $14.84 resistance and the $13.2 support. The ascending cyan trendline has also served as support over the past few days.
The price managed to climb above the $14 mark and flip it to support (cyan box). A retest of this area could offer a buying opportunity with a tight stop-loss set just below $13.77.
The $14.8 region (red box) and the $15.4 region can be used to take a profit. However, given the uncertainty behind Bitcoin, aggressive profit-taking could be beneficial. The weekend has arrived and lowered liquidity could see large moves within a short span of time.
The 21 and 55-period moving averages have snaked about one another in recent days to highlight the lack of strong momentum.
Rationale
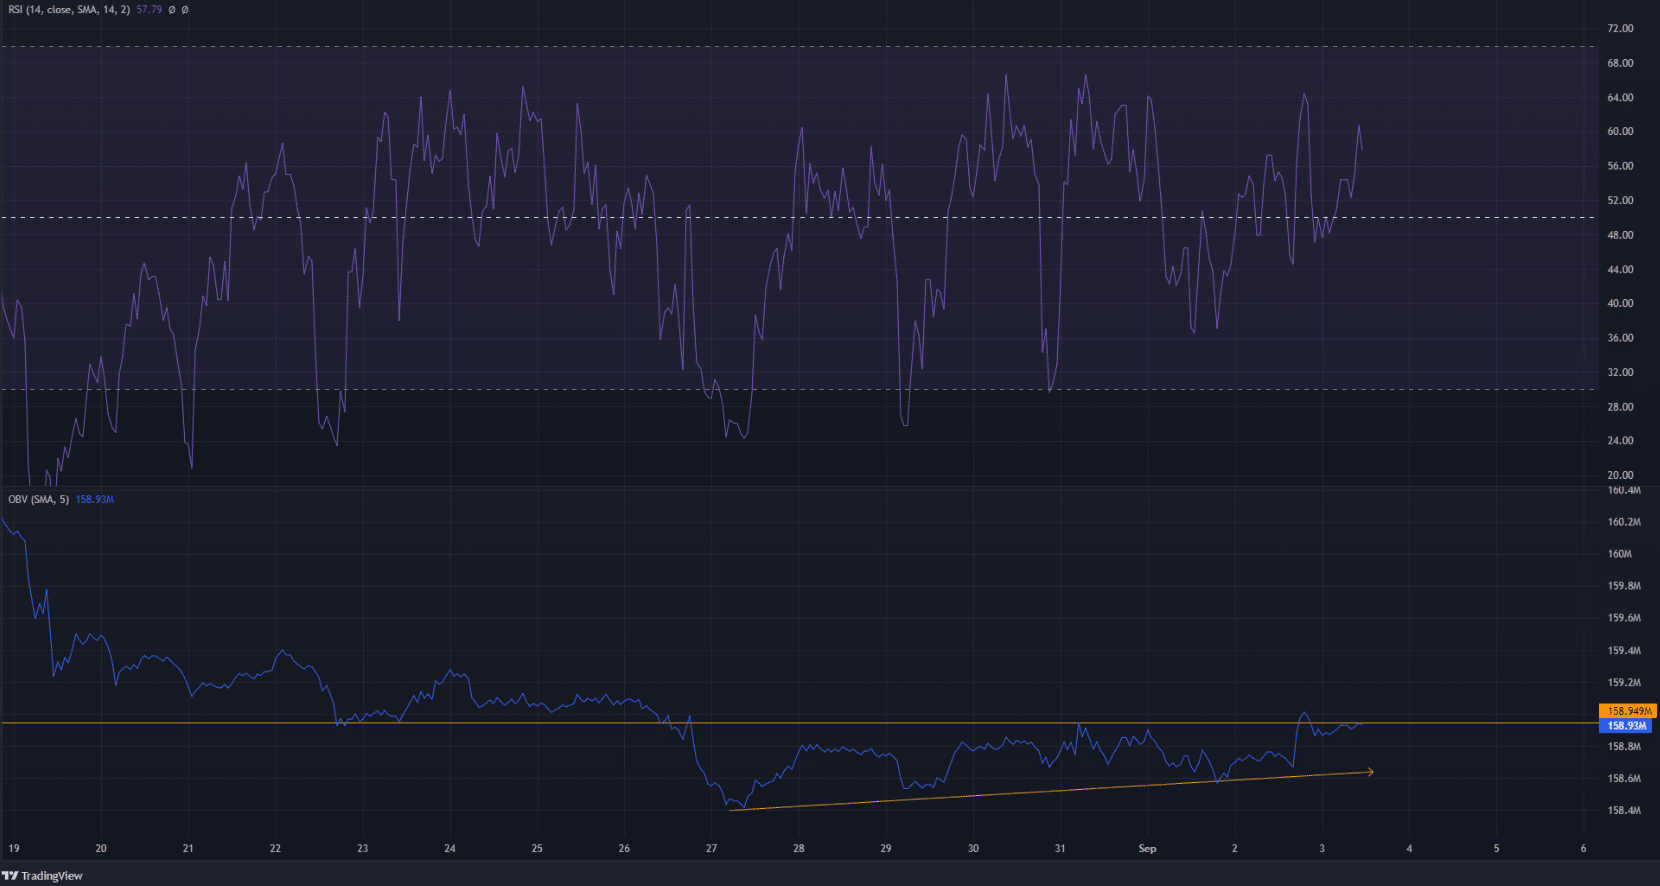
The Relative Strength Index (RSI) climbed back above neutral 50 the previous day. However, it has not really breached the 60-65 region over the past week. Hence, it was possible that another foray toward 65 could see an AXS pullback.
An encouraging observation for the bulls was the formation of higher lows on the On-Balance Volume (OBV). The buyers have been slightly stronger the past week, but the OBV was still unable to break resistance. A move past resistance, combined with a move above $14.84, could usher in a strong move upward for AXS.
Conclusion
The short-term price action highlighted that the flip of $14 to support meant a move toward $14.8 was likely. The trendline (cyan) can also be expected to act as support. To the north, $14.8 and $15.4 are significant resistance zones. Aggressive profit booking can be the safer route for a bullishly positioned trader.


