Before entering a long position, MATIC traders need to look out for these signs

Since touching the $1.70-mark in mid-June, MATIC prices have been on a decline. Monthly losses have amounted to 32% as the cryptocurrency gradually declined below the $1-mark. The lack of volatility over the past few days has resulted in some sideways movement for the digital asset, but prices remained vulnerable to another decline over the coming sessions.
At the time of writing, MATIC traded at $0.9.83, down by 5.3% over the last 24 hours.
MATIC 4-hour chart
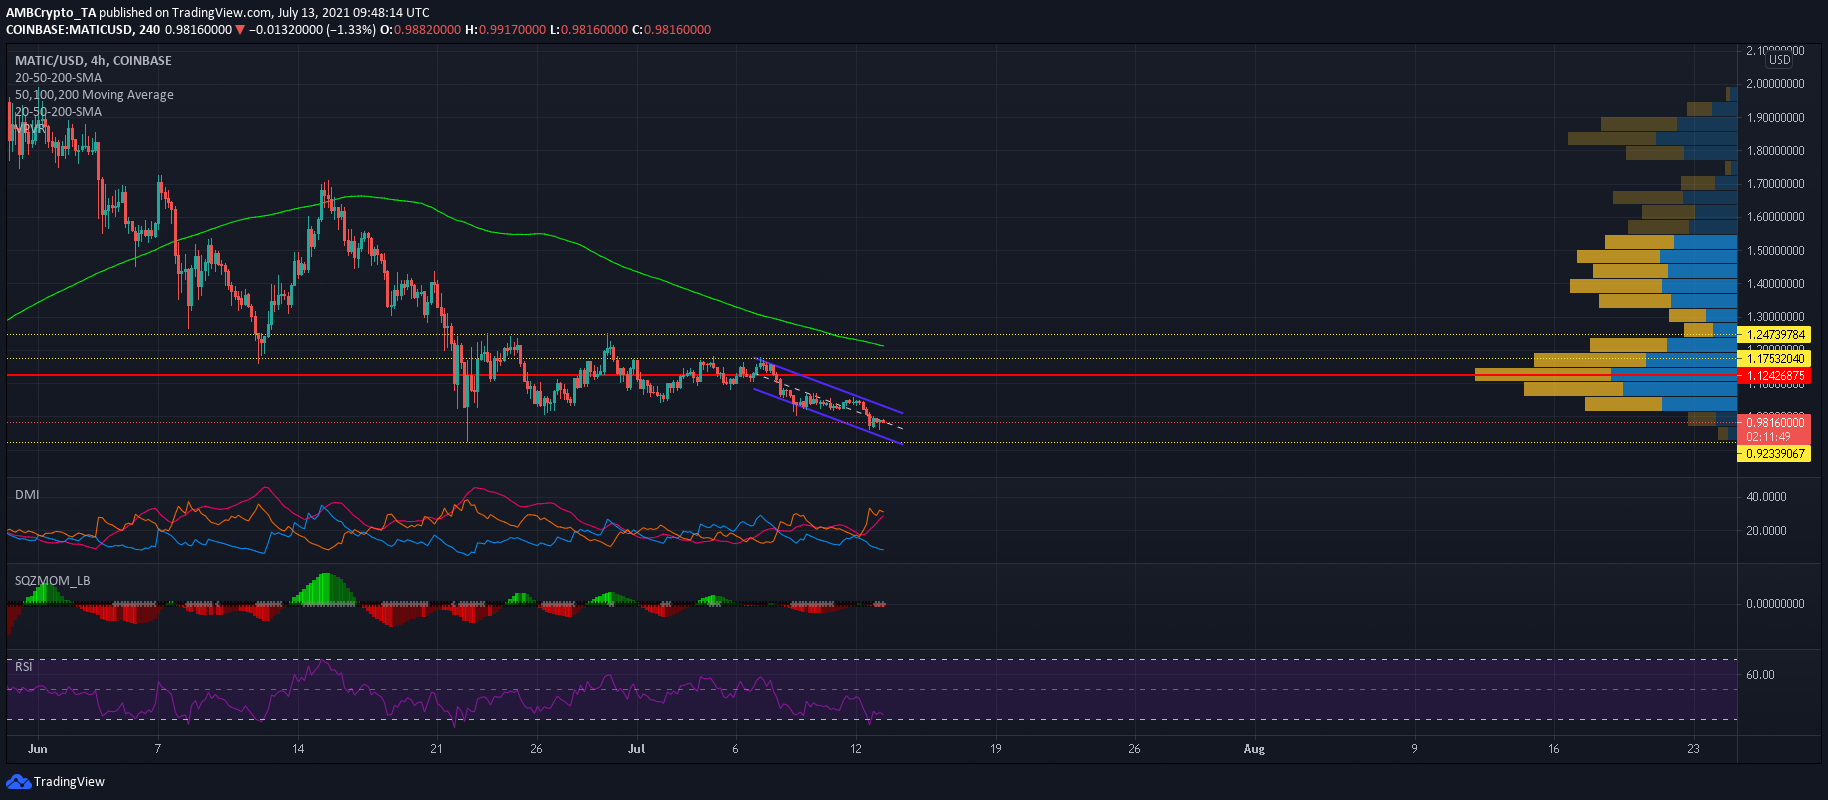
MATIC’s drop from $1.70 to $0.92 on 15 June was critical to its market structure which was severely weakened post the decline. A look at its chart showed that MATIC was immediately rejected at its 200-SMA (green) despite flipping it to bullish for a single session.
Since that point, there have been some attempts at a bullish comeback but prices have remained restricted below the $1.25- price level. Now trading within the confines of a down-channel, MATIC could see lower levels before an upward breakout is triggered from its pattern. 22nd June’s swing low of $0.924 would be in focus moving forward- a region that triggered a 20% surge previously.
Reasoning
Directional Movement Index’s -DI and +DI diverged as a bearish trend strengthened in the market. An ADX reading of 27 suggested that the market had become more directional and chances of additional losses were high. Squeeze Momentum Indicator’s red bars highlighted rising bearish momentum, whereas the ‘white dots’ represented a pickup in volatility. Relative Strength Index traded below 40, which was a sign of a weak market. However, a fall into the oversold would warrant a reversal.
Conclusion
MATIC’s indicators presented the possibility of an extended decline especially since volatility was on the up. Prices were expected to find support at their 22nd June low of $0.924- a region that could trigger a temporary rise for MATIC. Traders can play it safe and wait for MATIC to show signs of recovery at $0.924 before entering a long position.