Binance Coin, Aave, Decred Price Analysis: 17 April

Binance Coin reclaimed the $520-$530 region as one of demand and flipped $533 to support. Aave formed a triangle pattern and awaited breakout confirmation, while Decred saw a pullback after a strong move north.
Binance Coin [BNB]
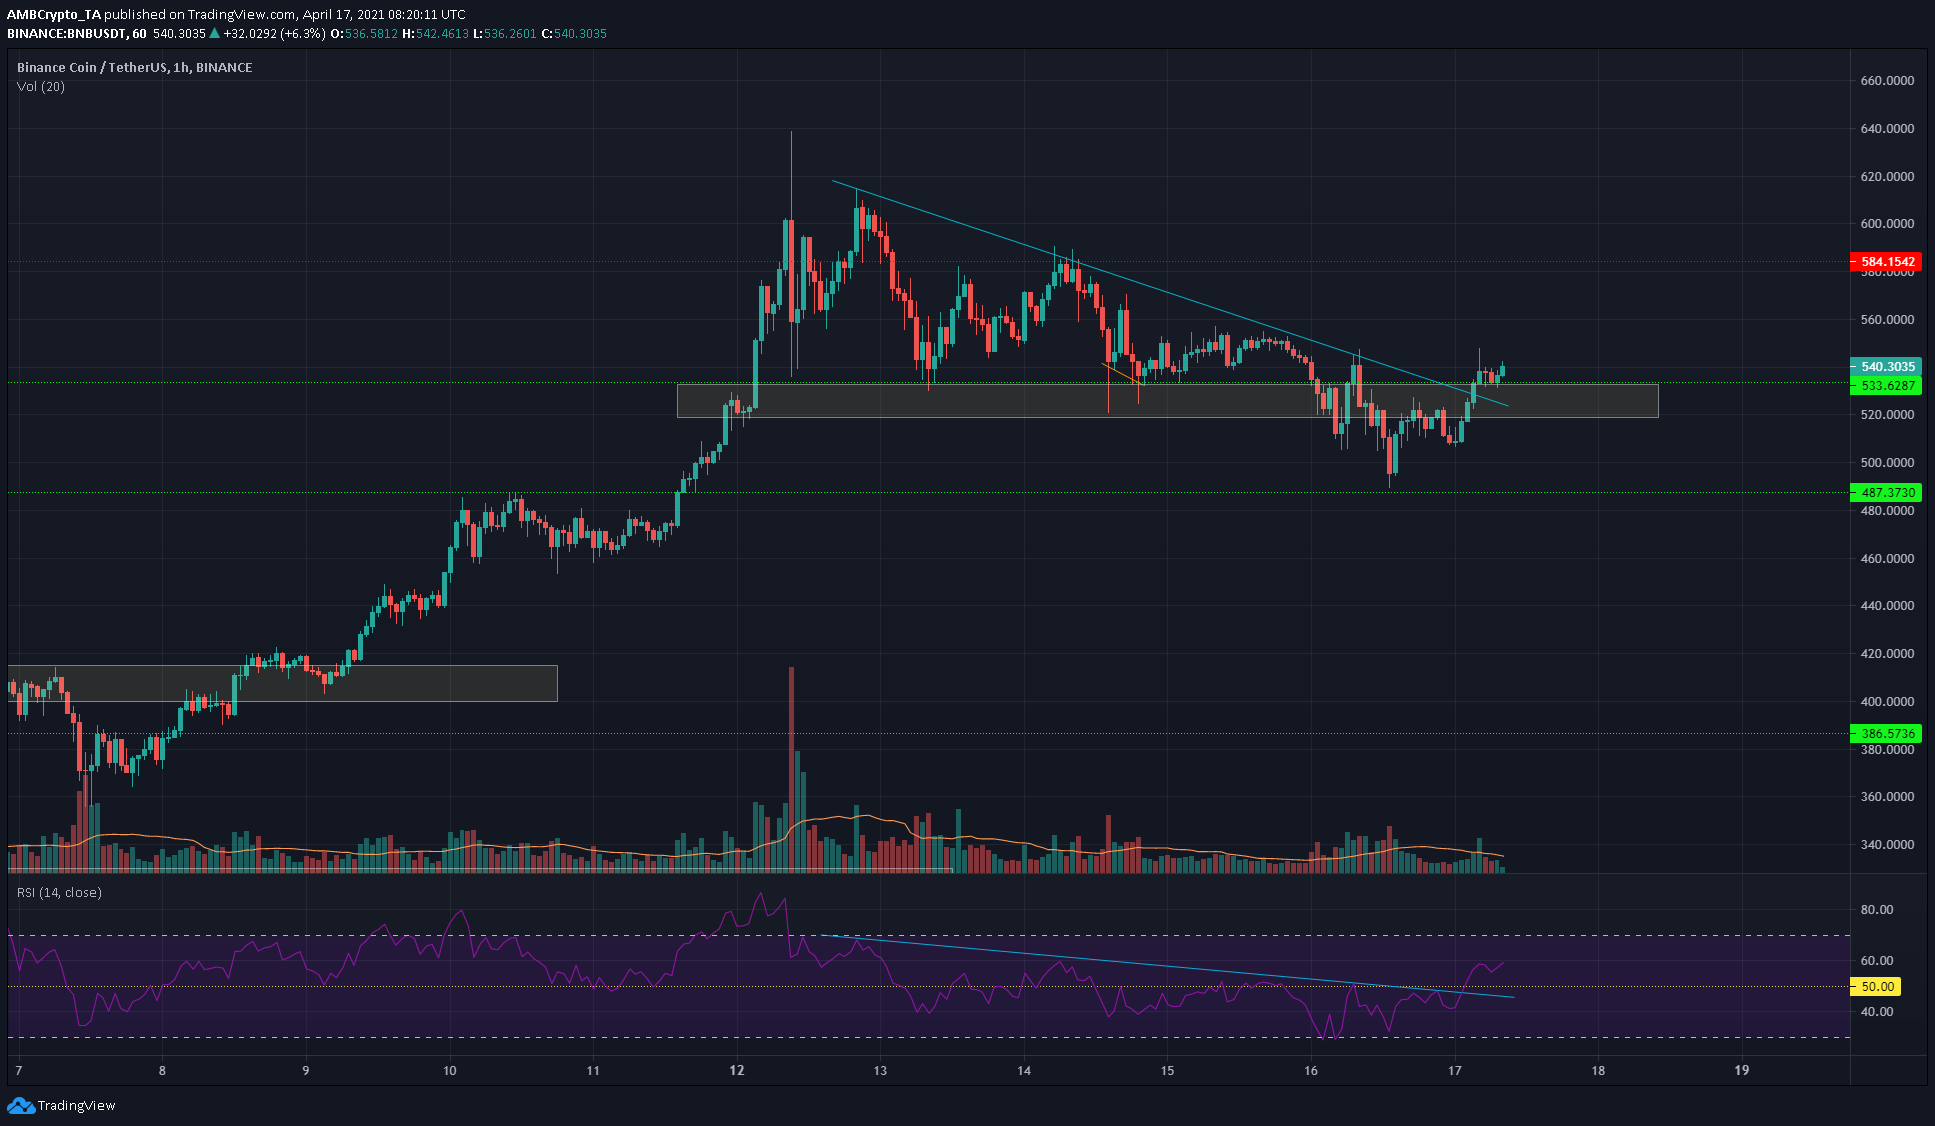
On the hourly chart, BNB appears to have initiated its next leg upward. The price climbed back above the highlighted region in the vicinity of $520 and seemed to flip it to demand. The RSI climbed back above neutral 50 and alongside the price, appears to have broken the downtrend it had previously been in.
On longer timeframes (up to 6-hour), Binance Coin’s momentum briefly flipped to slightly bearish before recovery once more. News of the quarterly BNB burn came more like a “sell the news” event, with BNB dropping from $530 to $490 in the hours following the announcement.
Aave [AAVE]
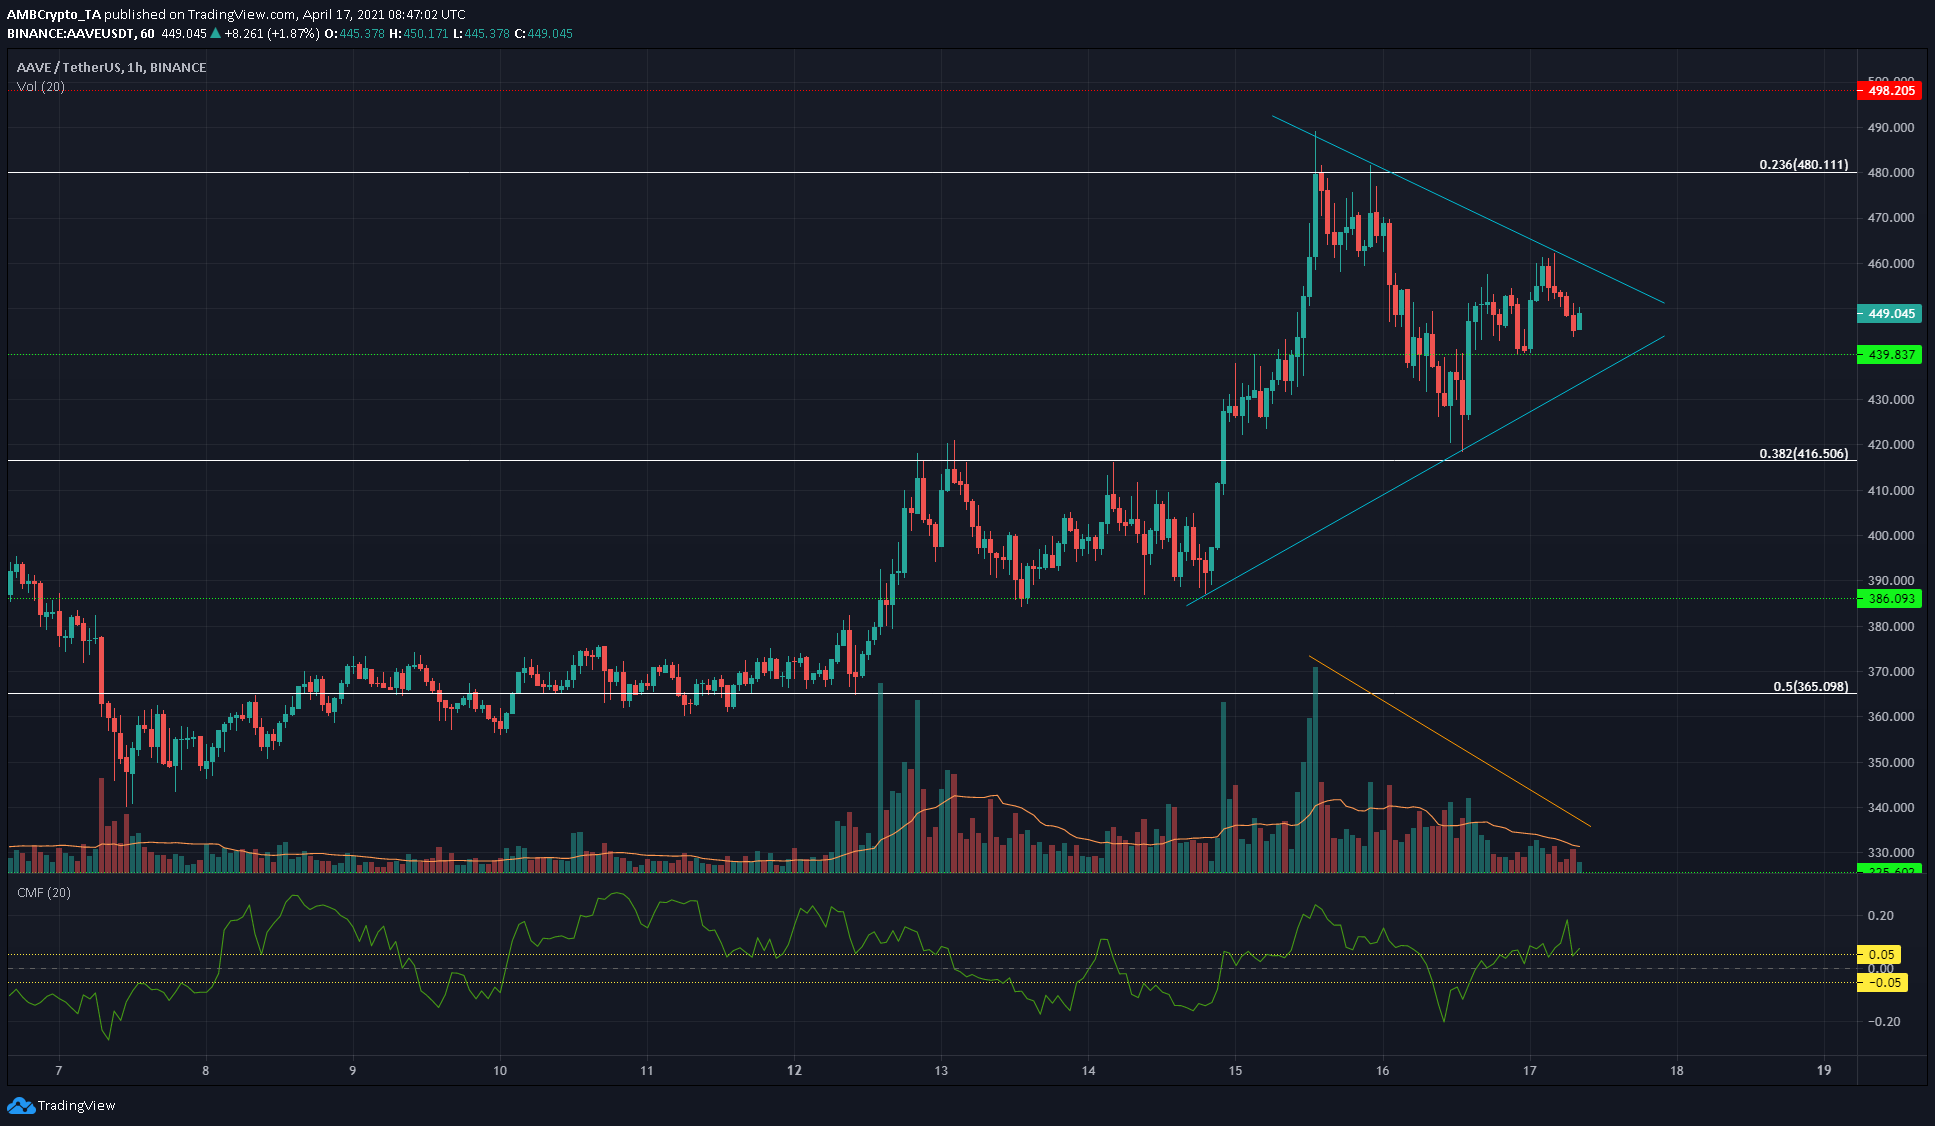
The $440 level was flipped to support in recent hours after the recent drop saw AAVE rejected at $480 and slide swiftly to $420. The Chaikin Money Flow remained above the +0.05 value to show that net capital flow was into the market, a sign of demand.
The price also formed a symmetrical triangle pattern on dropping trading volume, a continuation pattern sees the prices follow the previous trend. A session close beneath $440 might not be more than a liquidity hunt, however, dropping below $426-$428 would be a sign of short-term bearish pressure that could see AAVE retest $416.
Decred [DCR]
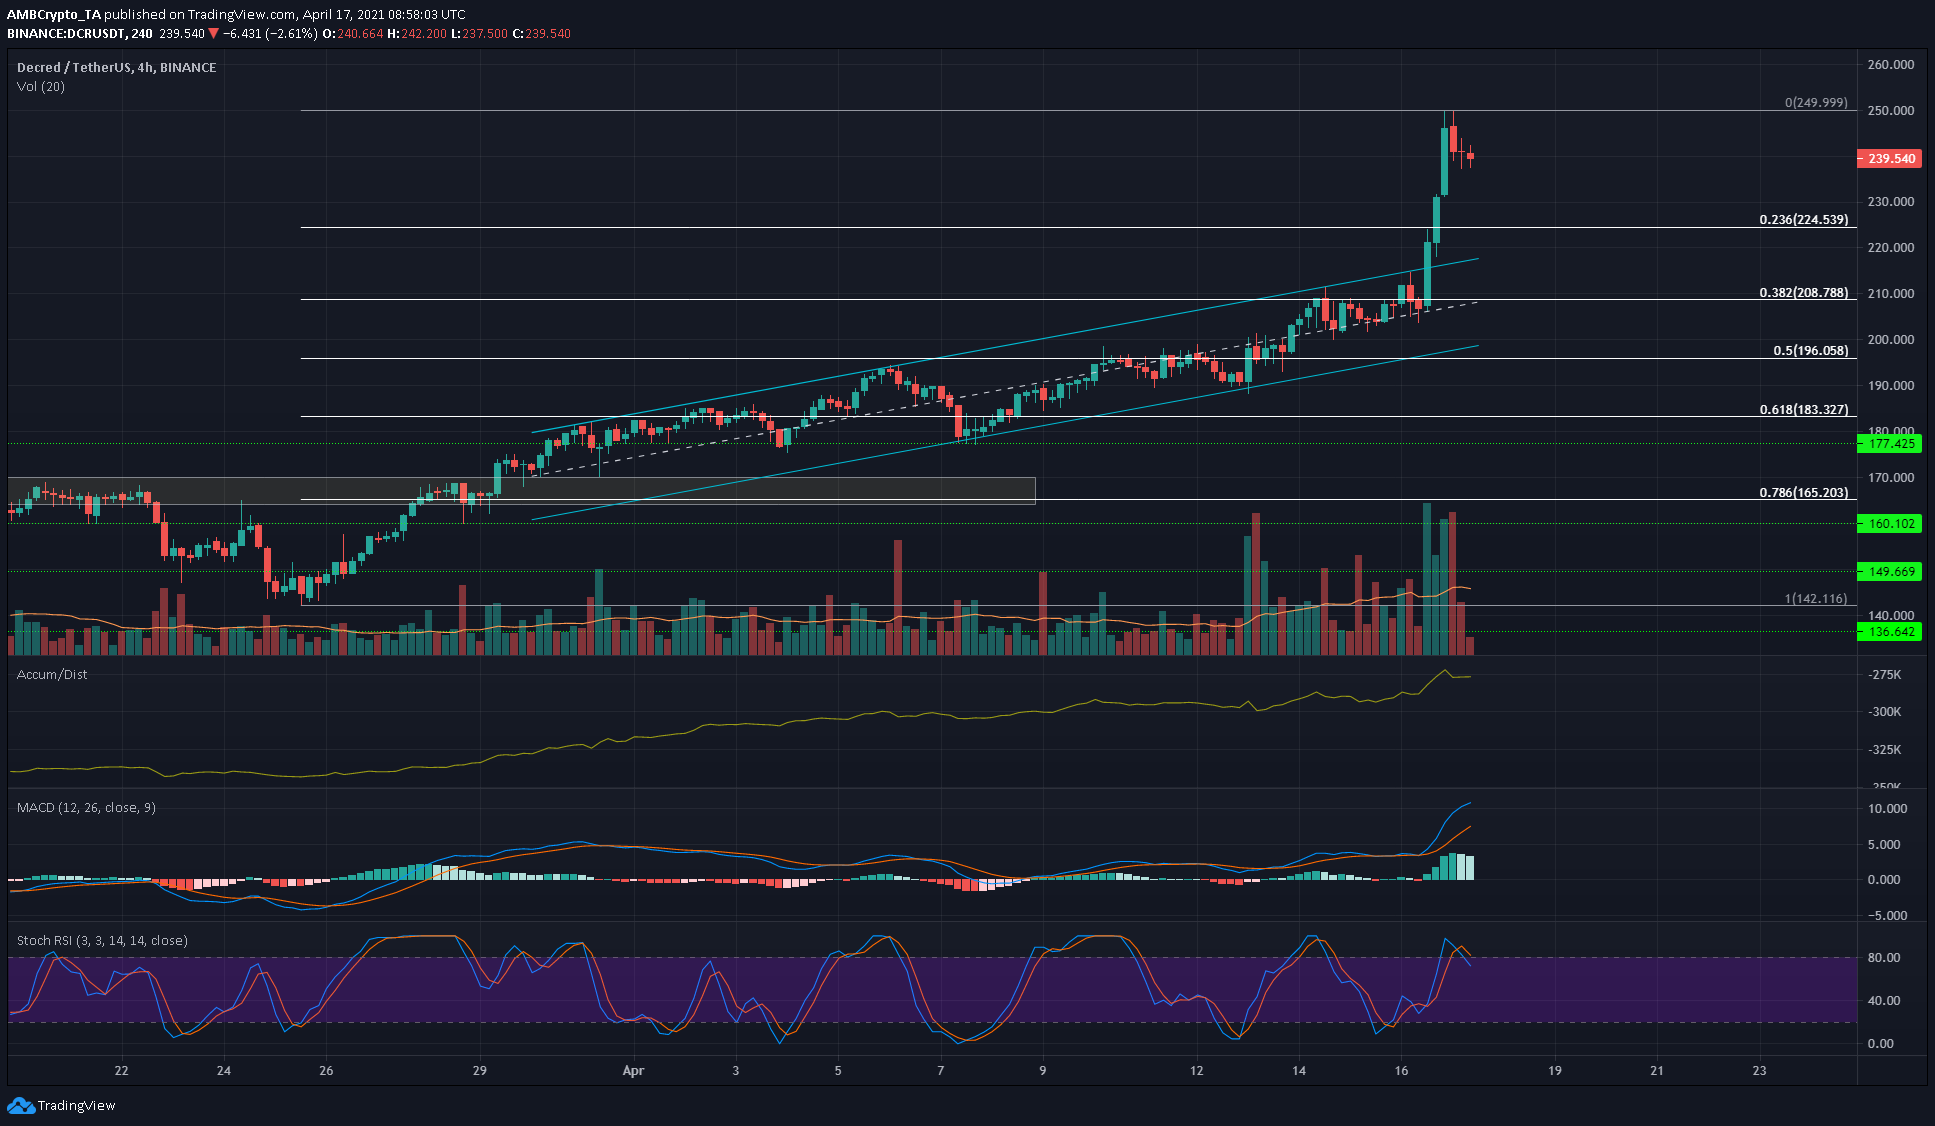
DCR broke out to the upside of a rising channel as demand drove prices to $200. At the time of writing, DCR saw a pullback as recent momentum was halted at the psychological $250 mark.
The A/D line was in an uptrend alongside price to show this move was driven by demand from buyers. The MACD also showed strong bullish momentum, and the distance between the MACD and signal lines hint at overbought conditions. The Stochastic RSI was also correcting from overbought territory. A retracement level lies at $224 and could act as support.