Binance Coin, Compound, Decred Price Analysis 07 February

Altcoins Binance Coin and COMP retraced from their respective all-time highs as momentum shifted towards the bearish side. However, BNB could pick up once again after a bullish divergence was spotted on the charts. Decred signaled a bearish pullback after snapping a local high.
Binance Coin [BNB]

The hourly charts showed that momentum on Binance Coin switched to the selling side as the cryptocurrency retraced by 6% from its most recent all-time high. The Awesome Oscillator highlighted the change in momentum as the red bars moved below the equilibrium mark. However, healthy trading volumes and a noticeable presence of buyers were positive signs for BNB as losses were cushioned at $68.8.
A bullish divergence on the Relative Strength Index was an indication of a price rise towards record levels once again. The index also rose sharply towards the overbought region. In the case of a fall, the next area of support lies at $63.3.
Compound [COMP]
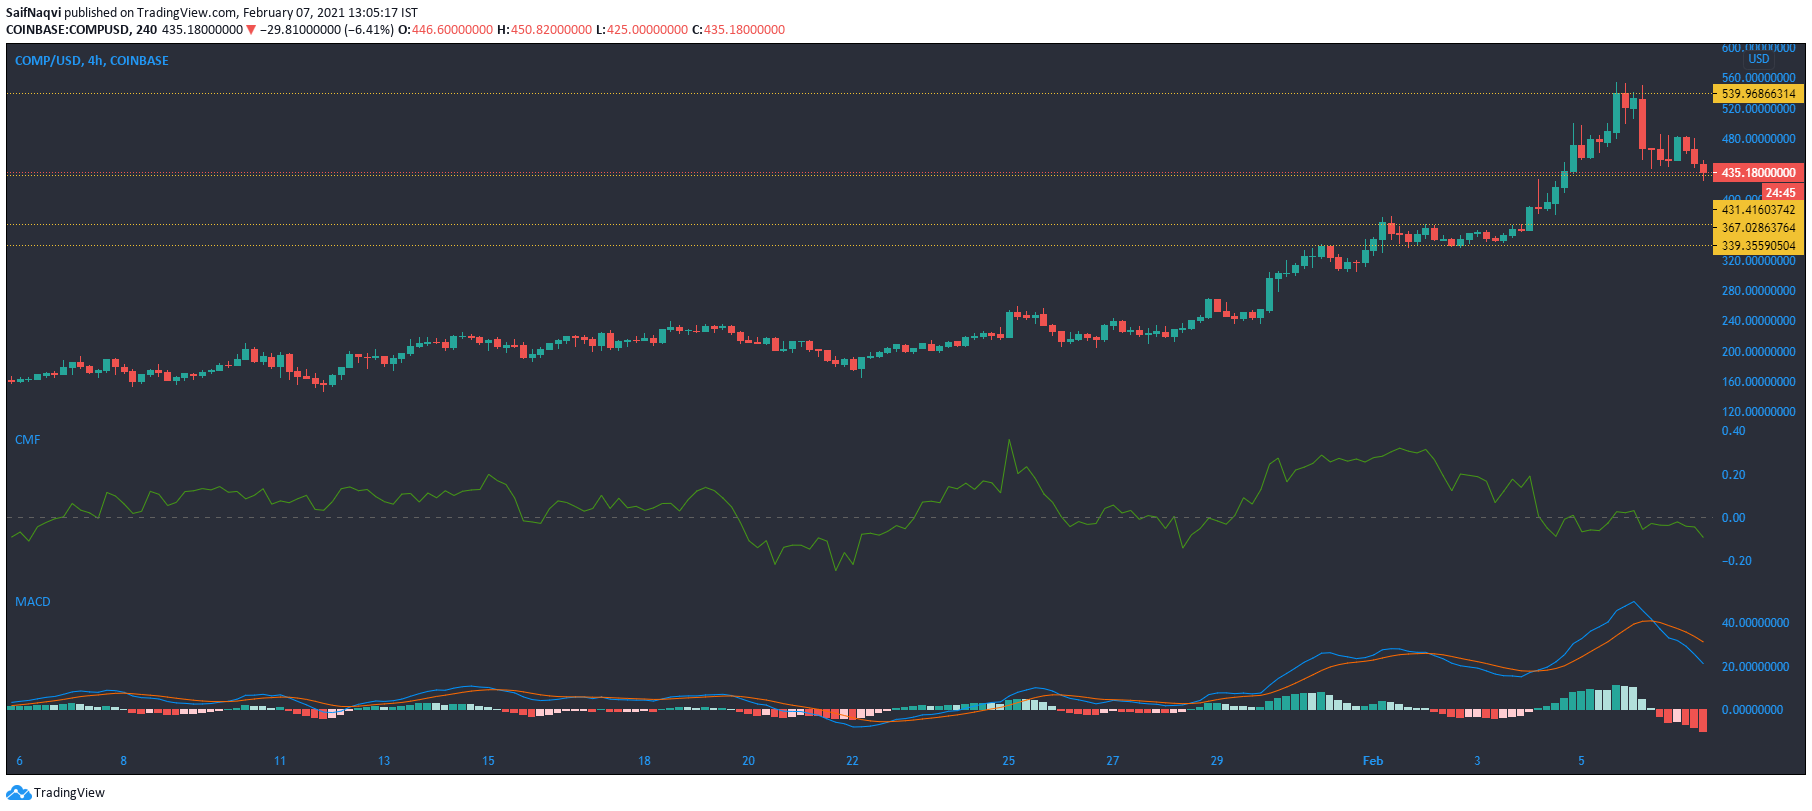
A bearish pullback over the past few sessions saw Compound move lower from its all-time high of over $540. The fall also diminished its market cap, which dropped below the $2 billion mark at the time of writing. Further bearishness could be due for the crypto as trading volumes and buyers shrunk over the past 24 hours.
Capital outflows were significant as the Chaikin Money Flow slipped below the half-line, while the MACD showed strong bearish momentum. The bears could target $367 and $339.3 support levels in an extended bearish scenario.
Decred [DCR]
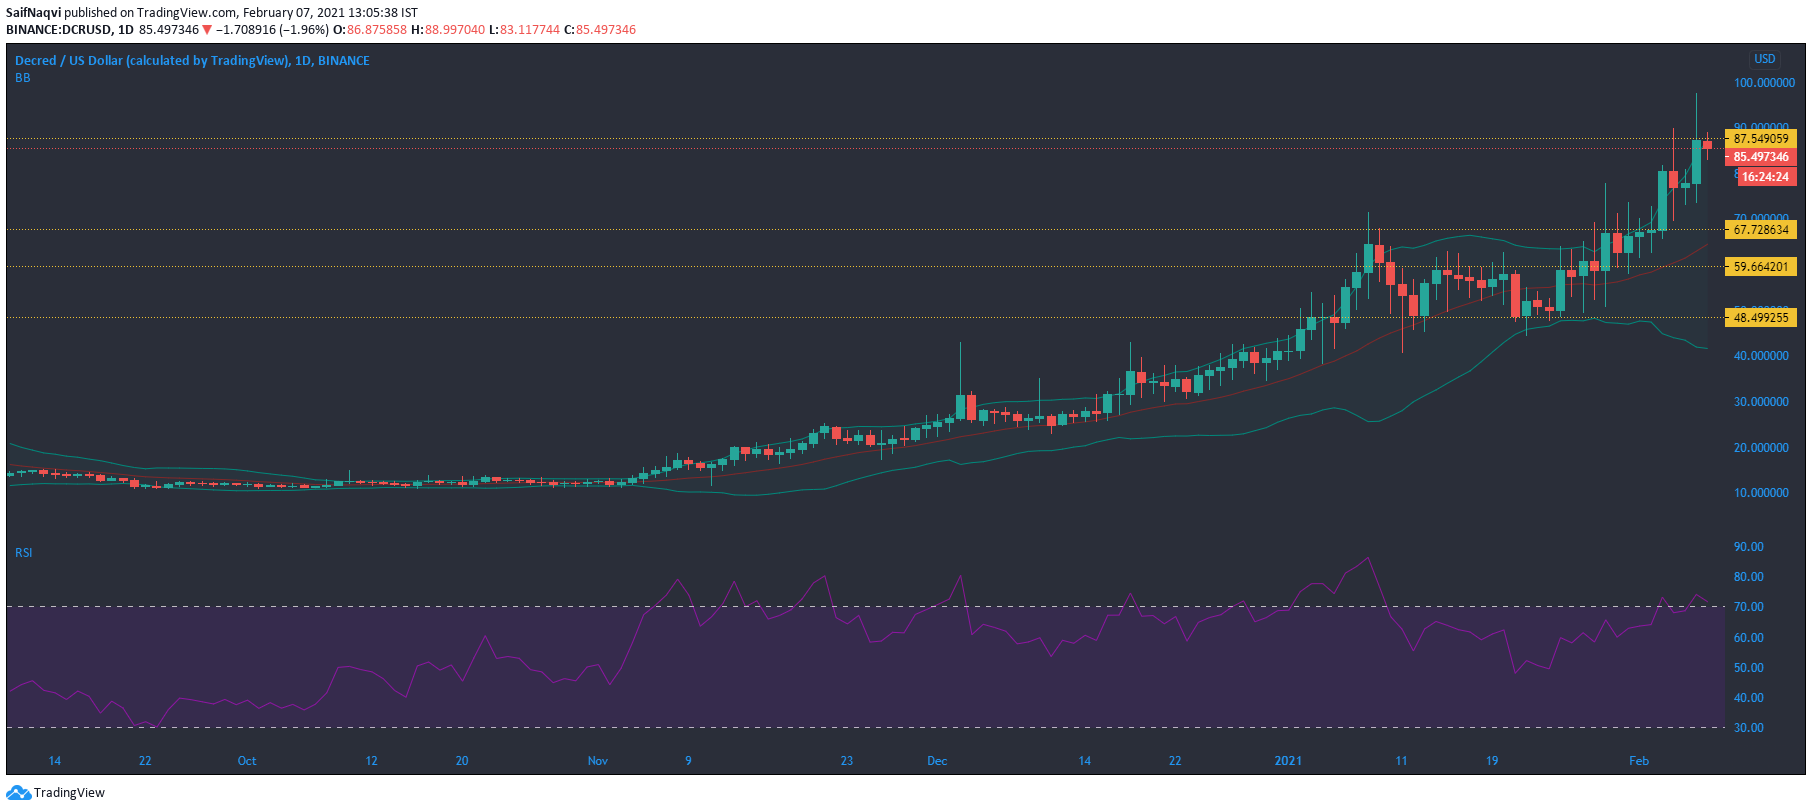
The daily timeframe highlighted the bullish nature of Decred over the past two weeks as it climbed above several resistance levels. However, the on-chain metrics suggested that the cryptocurrency was primed for a reversal after touching a local high of over $87.
The candlesticks traded on the upper band of the Bollinger Bands, and a reversal towards the lower band was a possibility over the coming sessions. The Relative Strength Index also backed the bearish prediction as the index was at its saturation point in the overbought zone. In the event of a fall, support levels reside at $67.7, $59.6, and $48.5. Since the 24-hour trading volumes were up by 200%, a fall towards $48.5 support was an unlikely outcome.