Binance Coin, Cosmos, DASH Price Analysis: 07 July

Most cryptocurrencies in the market were noting consolidated price movements over the last 24 hours, with some steady gains seen across the board too. Binance Coin and DASH’s trading volumes, for instance, increased by 110% and 10% over the last 24 hours, while ATOM’s trading volume fell by 50.40%.
Binance recently made headlines after it temporarily suspended payments from the EU’s SEPA network.
Binance Coin [BNB]

BNB/USD, TradingView
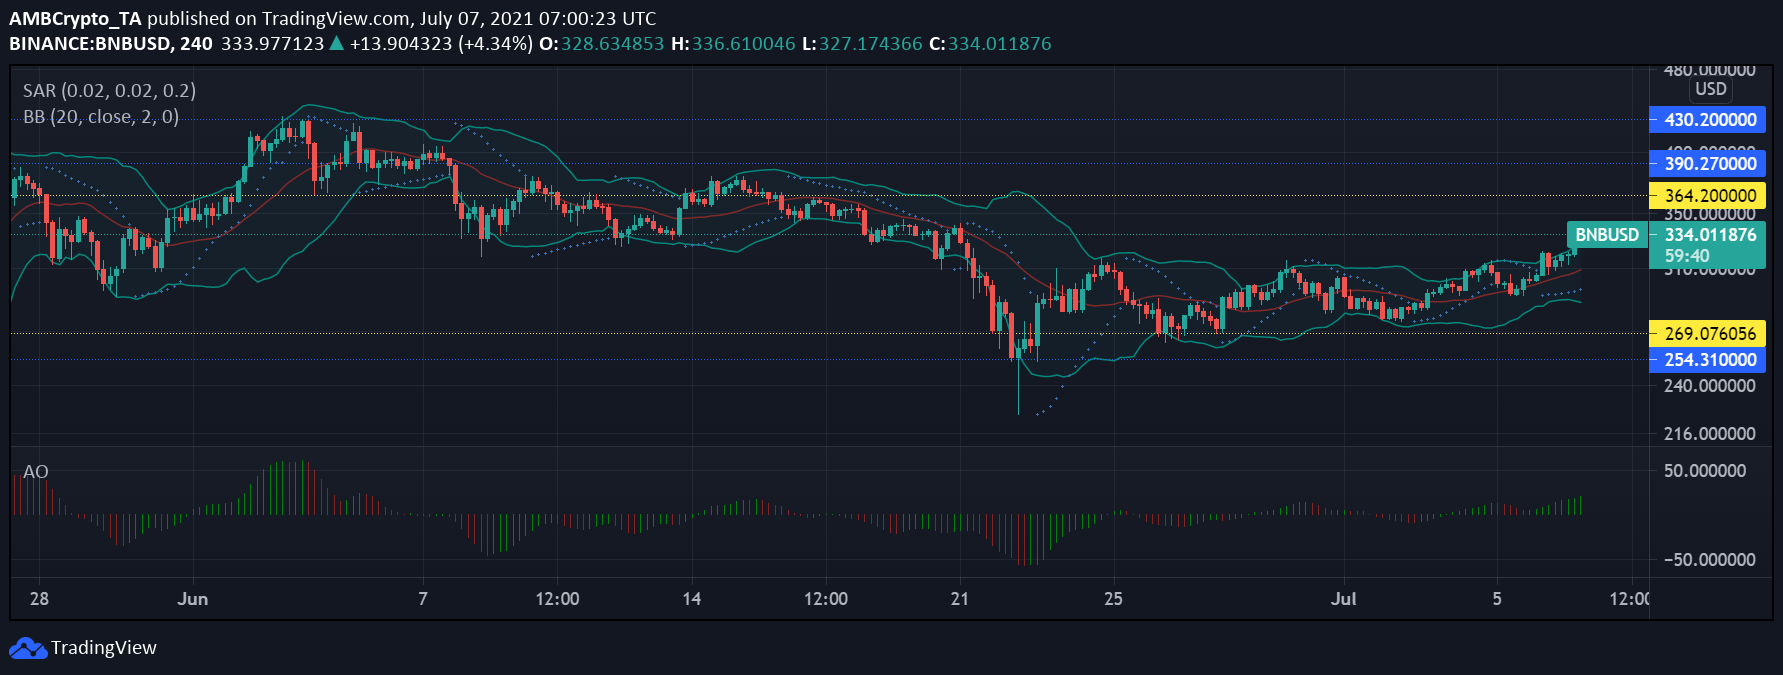
Binance Coin has had a consolidated trading range over the past couple of days, though the altcoin did see signs of an uptrend after its price hiked by 5% in 24 hours. At the time of writing, the asset was priced at $334.01, having gained by 11.2% in just one week.
If market bulls stick around to push the price further up, then the next resistance level of the coin would be $364.20 and if the token dips in valuation, the support level it could rest on would be at $290. With respect to volatility, the Bollinger Bands noted minor divergence and pointed to a period of some market volatility.
Since the crypto’s price was on the rise, the Parabolic SAR too demonstrated an uptrend as the dotted lines were visible below the candlesticks. The Awesome Oscillator flashed clear bullish signals from 5 July onwards as BNB had started to ascend on the charts.
Cosmos [ATOM]

ATOM/USD, TradingView
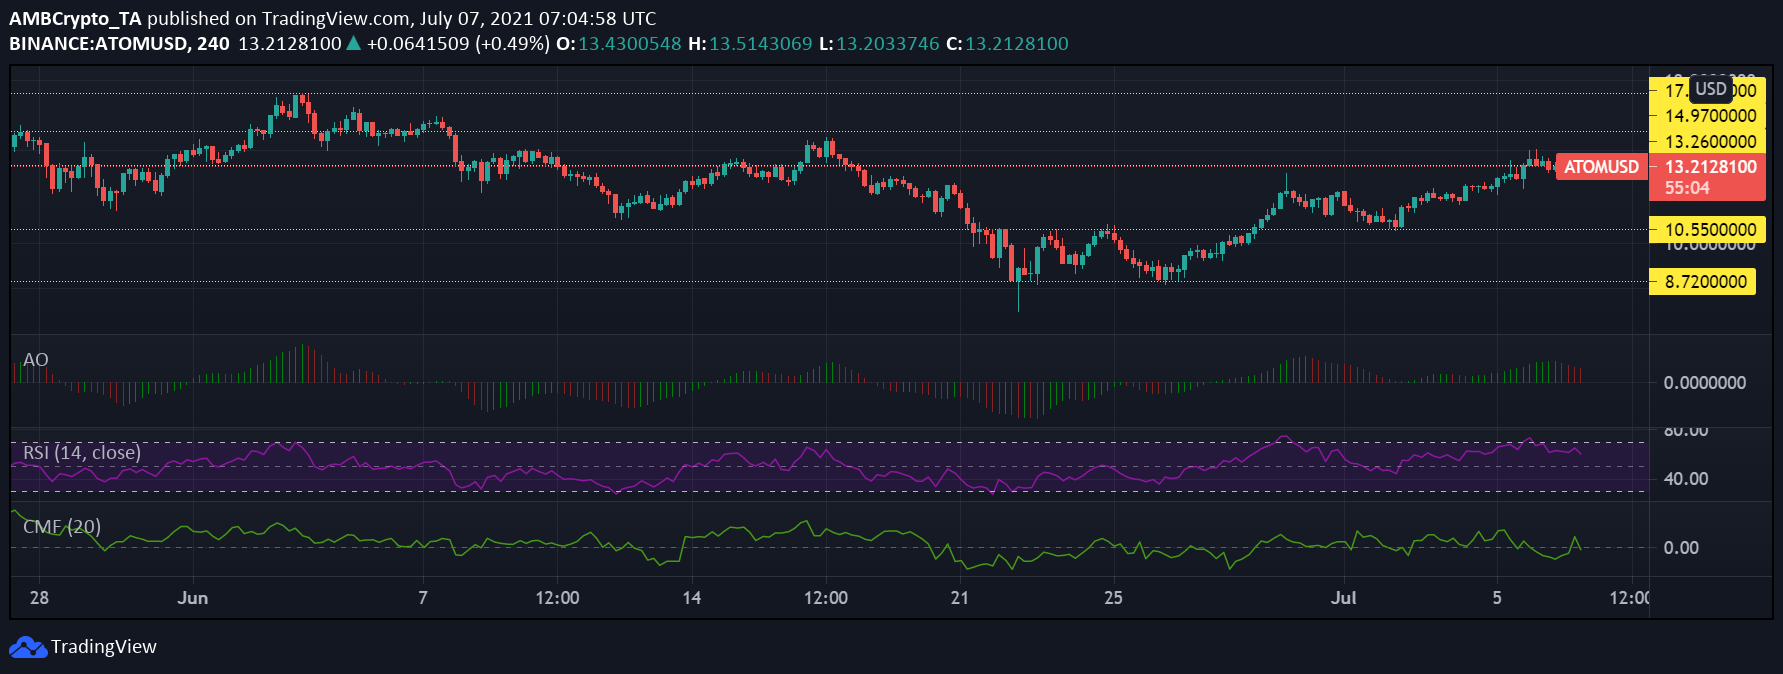
ATOM’s uptrend was stalled as the coin hovered around $13.20 for the last 48 hours. There hasn’t been much price movement, as seen from the technical analysis charts. The digital token noted a 2.1% decline over the past 24 hours and was trading at $13.21. Despite steadily being on the up since 26 June, the coin couldn’t get the bulls to break through the $14.97 resistance level.
Buying power was still quite prevalent in the market, despite a drop in buying pressure seen by the Relative Strength Index. The altcoin was in the overbought zone twice over the last two weeks, with buyers still exceeding sellers in the market. The Chaikin Money Flow also registered a fall in capital inflows, at the time of writing.
As the crypto asset recorded no significant price movement and was slightly on a downtrend, the Awesome Oscillator registered the onset of a bearish signal.
DASH

DASH/USD, TradingView
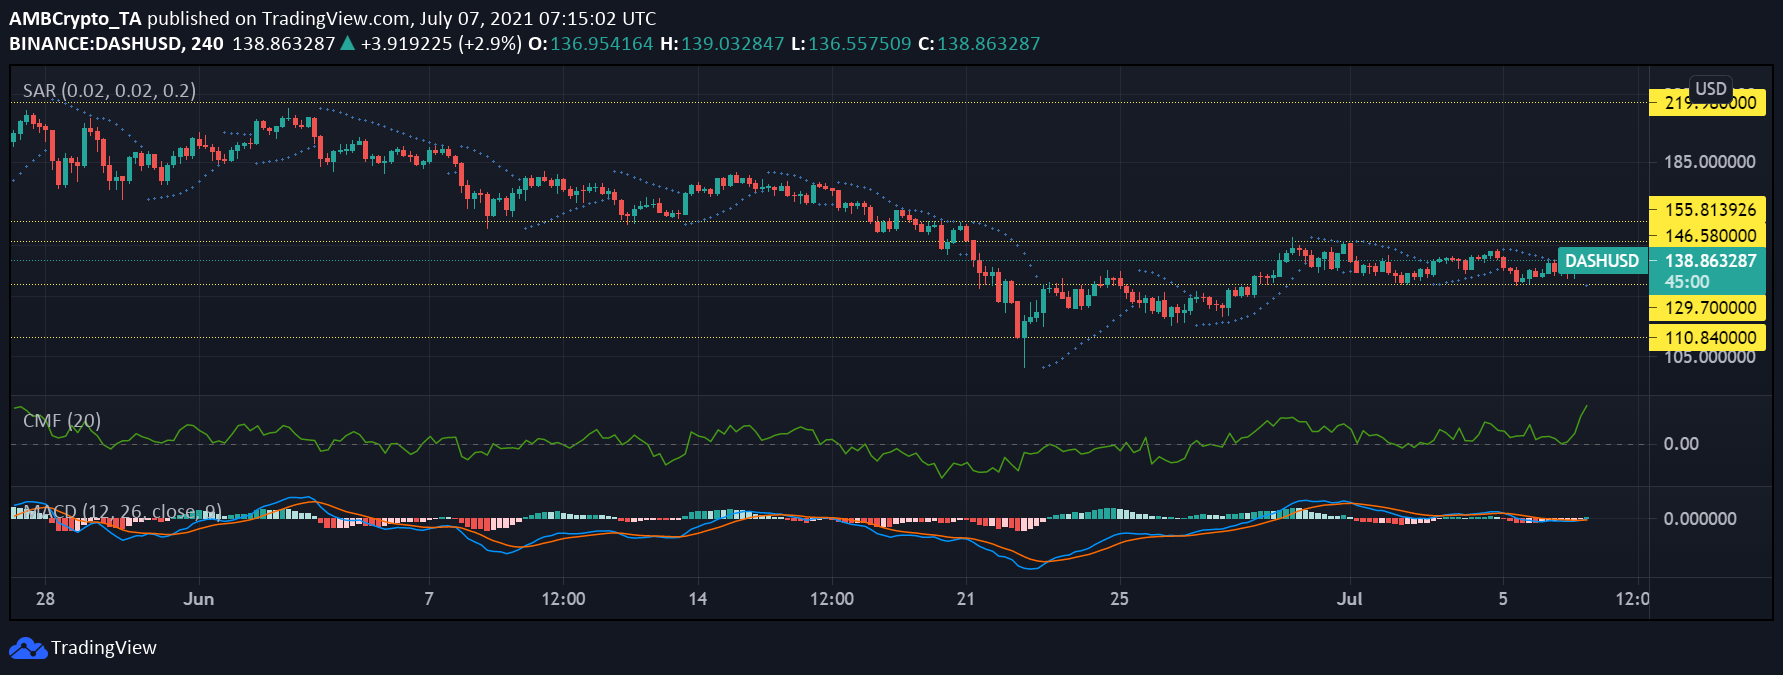
DASH‘s price action oscillated between its immediate support and resistance levels. It had not broken past the support level of $130 and the resistance level of $146. Over the last one week, the coin’s prices only increased by 1.2% and at the time of writing, it was trading in the green after noting an hourly gain of 0.5%.
As the price consolidated, the market attracted buyers as they would look at this situation as an entry point to the market. The Chaikin Money Flow noted a steep increase in capital inflows over outflows. The MACD pointed to a bullish crossover on 7 July and the emergence of a bullish signal on the indicator.
In correspondence to the bullish signal, the Parabolic SAR underlined the presence of a dotted line below the candlesticks and by extension, an uptrend.


