Binance Coin, Cosmos, Dogecoin Price Analysis: 19 March

Binance Coin slid to $240, but was recovering back towards $277 once again, with the alt recording higher lows on the way. Further down the crypto-ladder, Cosmos broke out past $21.3 and a dip to $21.4 was quickly bought up. Finally, Dogecoin was in a short-term stasis.
Binance Coin [BNB]
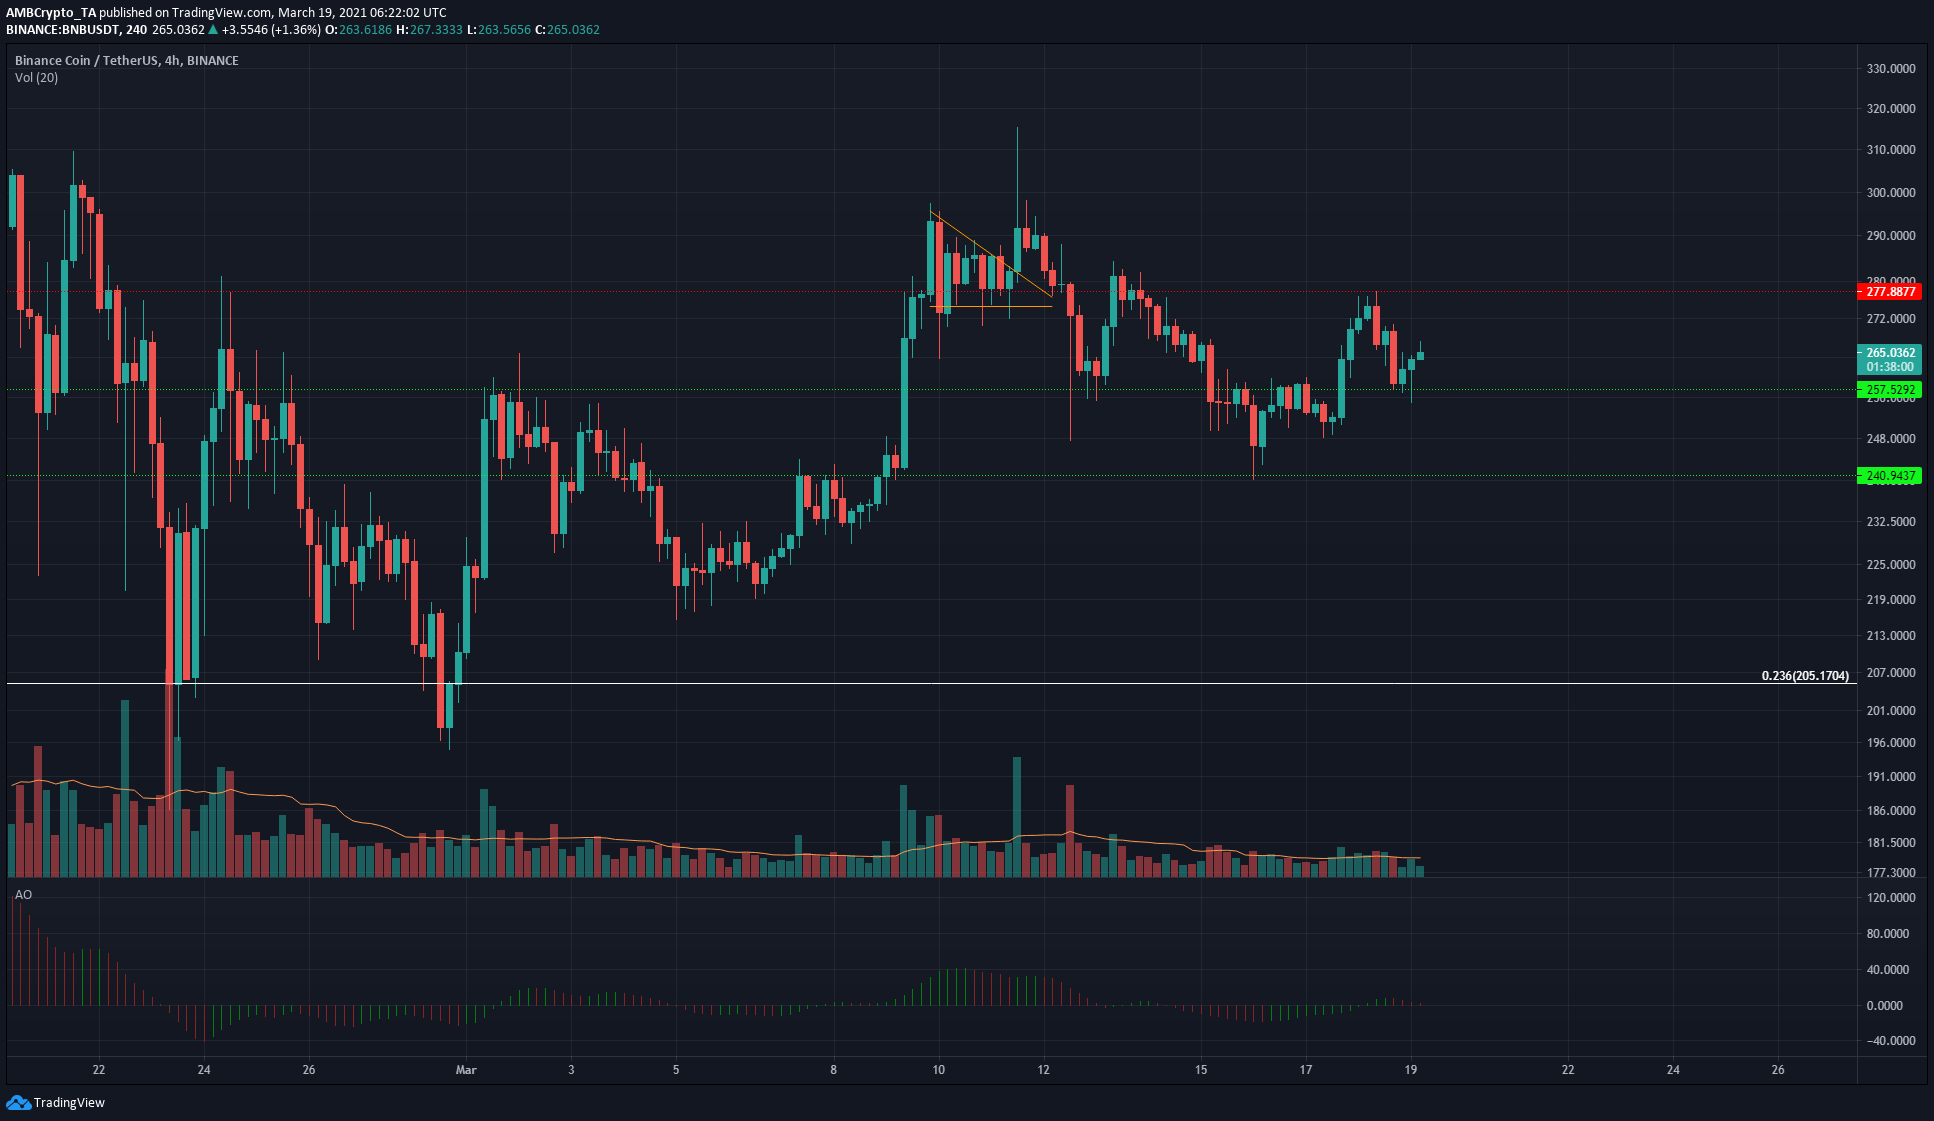
BNB has been somewhat indecisive in the markets over the past few days. There was a bearish retest of $280 a few days ago, and BNB sank to test $240. Subsequently, BNB saw a bounce to $257 and another move to $277, and recent hours saw the price confirm $257 as a level of support.
The Awesome Oscillator showed that momentum was not pronounced in either direction. The flip of $257 to support underlined some strength on the part of the market’s bears, and the next couple of days could see BNB retest $277 once more.
In the near future, a rejection at $277 followed by the formation of a higher low for BNB would be an indication of bullish intent.
Cosmos [ATOM]
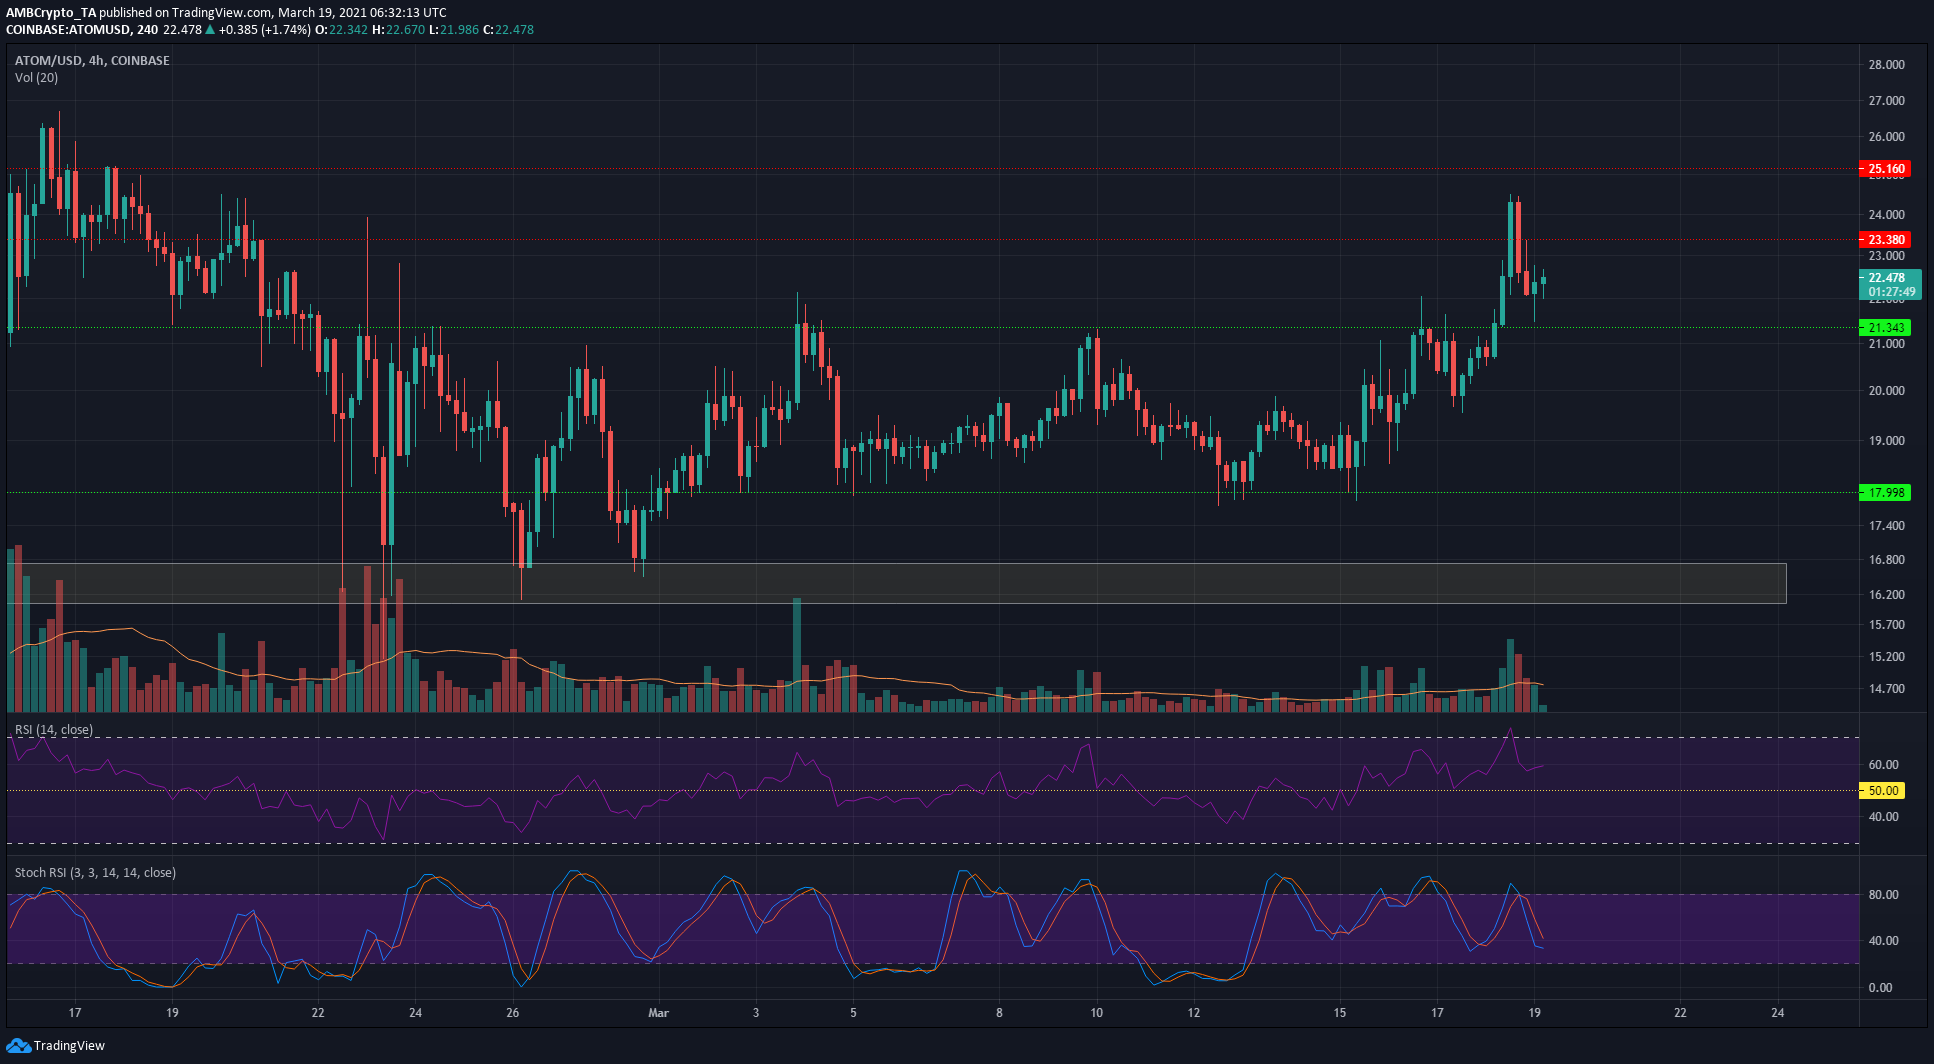
ATOM was bouncing between the $18 and 21.3-levels since early March. The past 24 hours saw ATOM break out past $21.3 with strong volume to reach $24.4. ATOM was forced to correct after the strong move, however, but momentum was still firmly in bullish hands.
The RSI was at 59, at the time of writing, while the Stochastic RSI had corrected itself from the overbought zone. ATOM saw a candlewick down to $21.47 that was pushed up a few hours ago as the session closed green, showing that there was demand for ATOM near the $21.3-support level.
The $23.38 and $25.16-levels will be the next resistance levels for ATOM.
Dogecoin [DOGE]
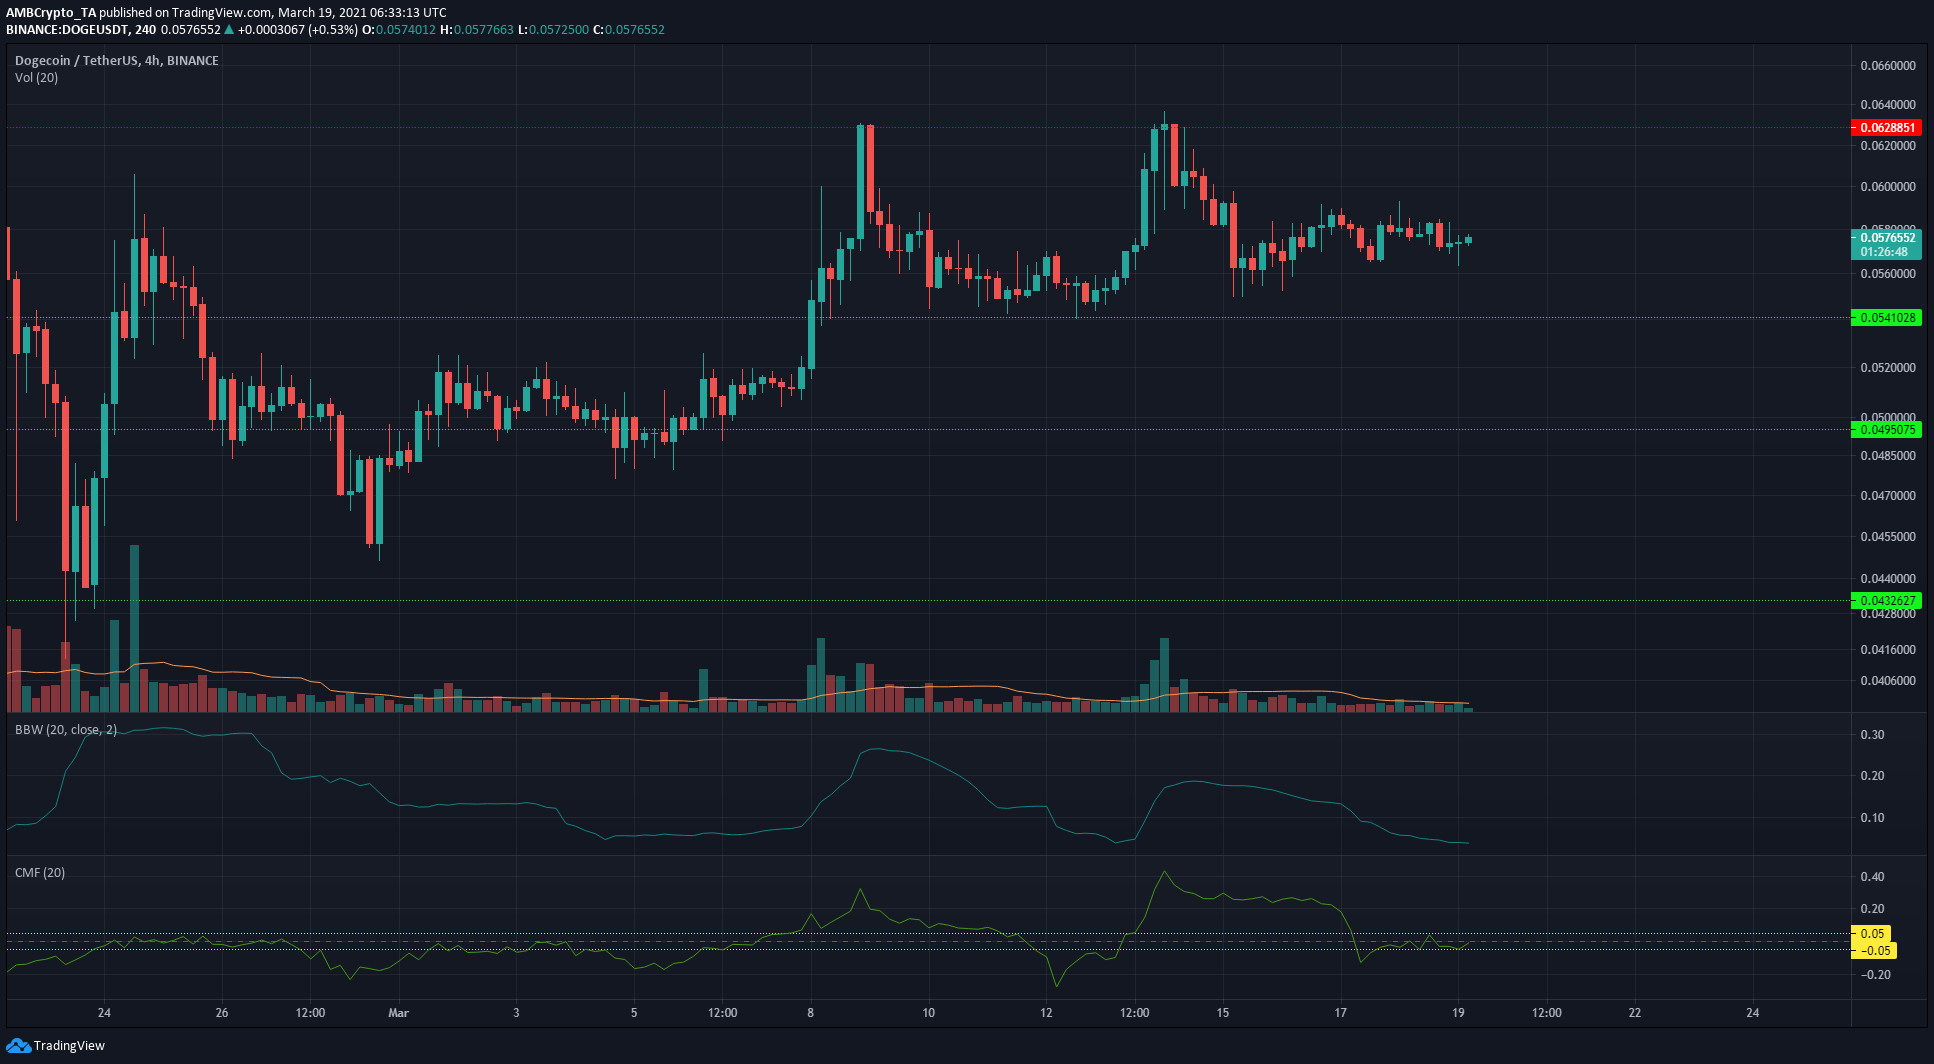
The Bollinger Bands Width Indicator has been dropping over the past two days, with DOGE finding a temporary equilibrium between buyers and sellers at $0.0575. The Chaikin Money Flow highlighted no net capital flows favoring either the buying or selling side, reaffirming the neutral momentum of DOGE in the markets.
The double rejection just above $0.06 over the past ten days for DOGE was a dent to bullish sentiment. As always, a significant trading volume is the best indication of a strong move for DOGE, and at the time of writing, that volume was insignificant.