Binance Coin, Ethereum Classic, EOS Price Analysis: 19 January

While the past 24-hours have been rather detrimental to the market cap, Binance Coin traded below its 20-50-200 SMA. After a red engulfing candlestick on 17 January, the alt saw 24-hour losses while its CMF deteriorated. Also, EOS lost the $2.7-mark after displaying a bearish bias.
On the contrary, Ethereum Classic saw gains over the past day but still was in a low volatility phase.
Binance Coin (BNB)
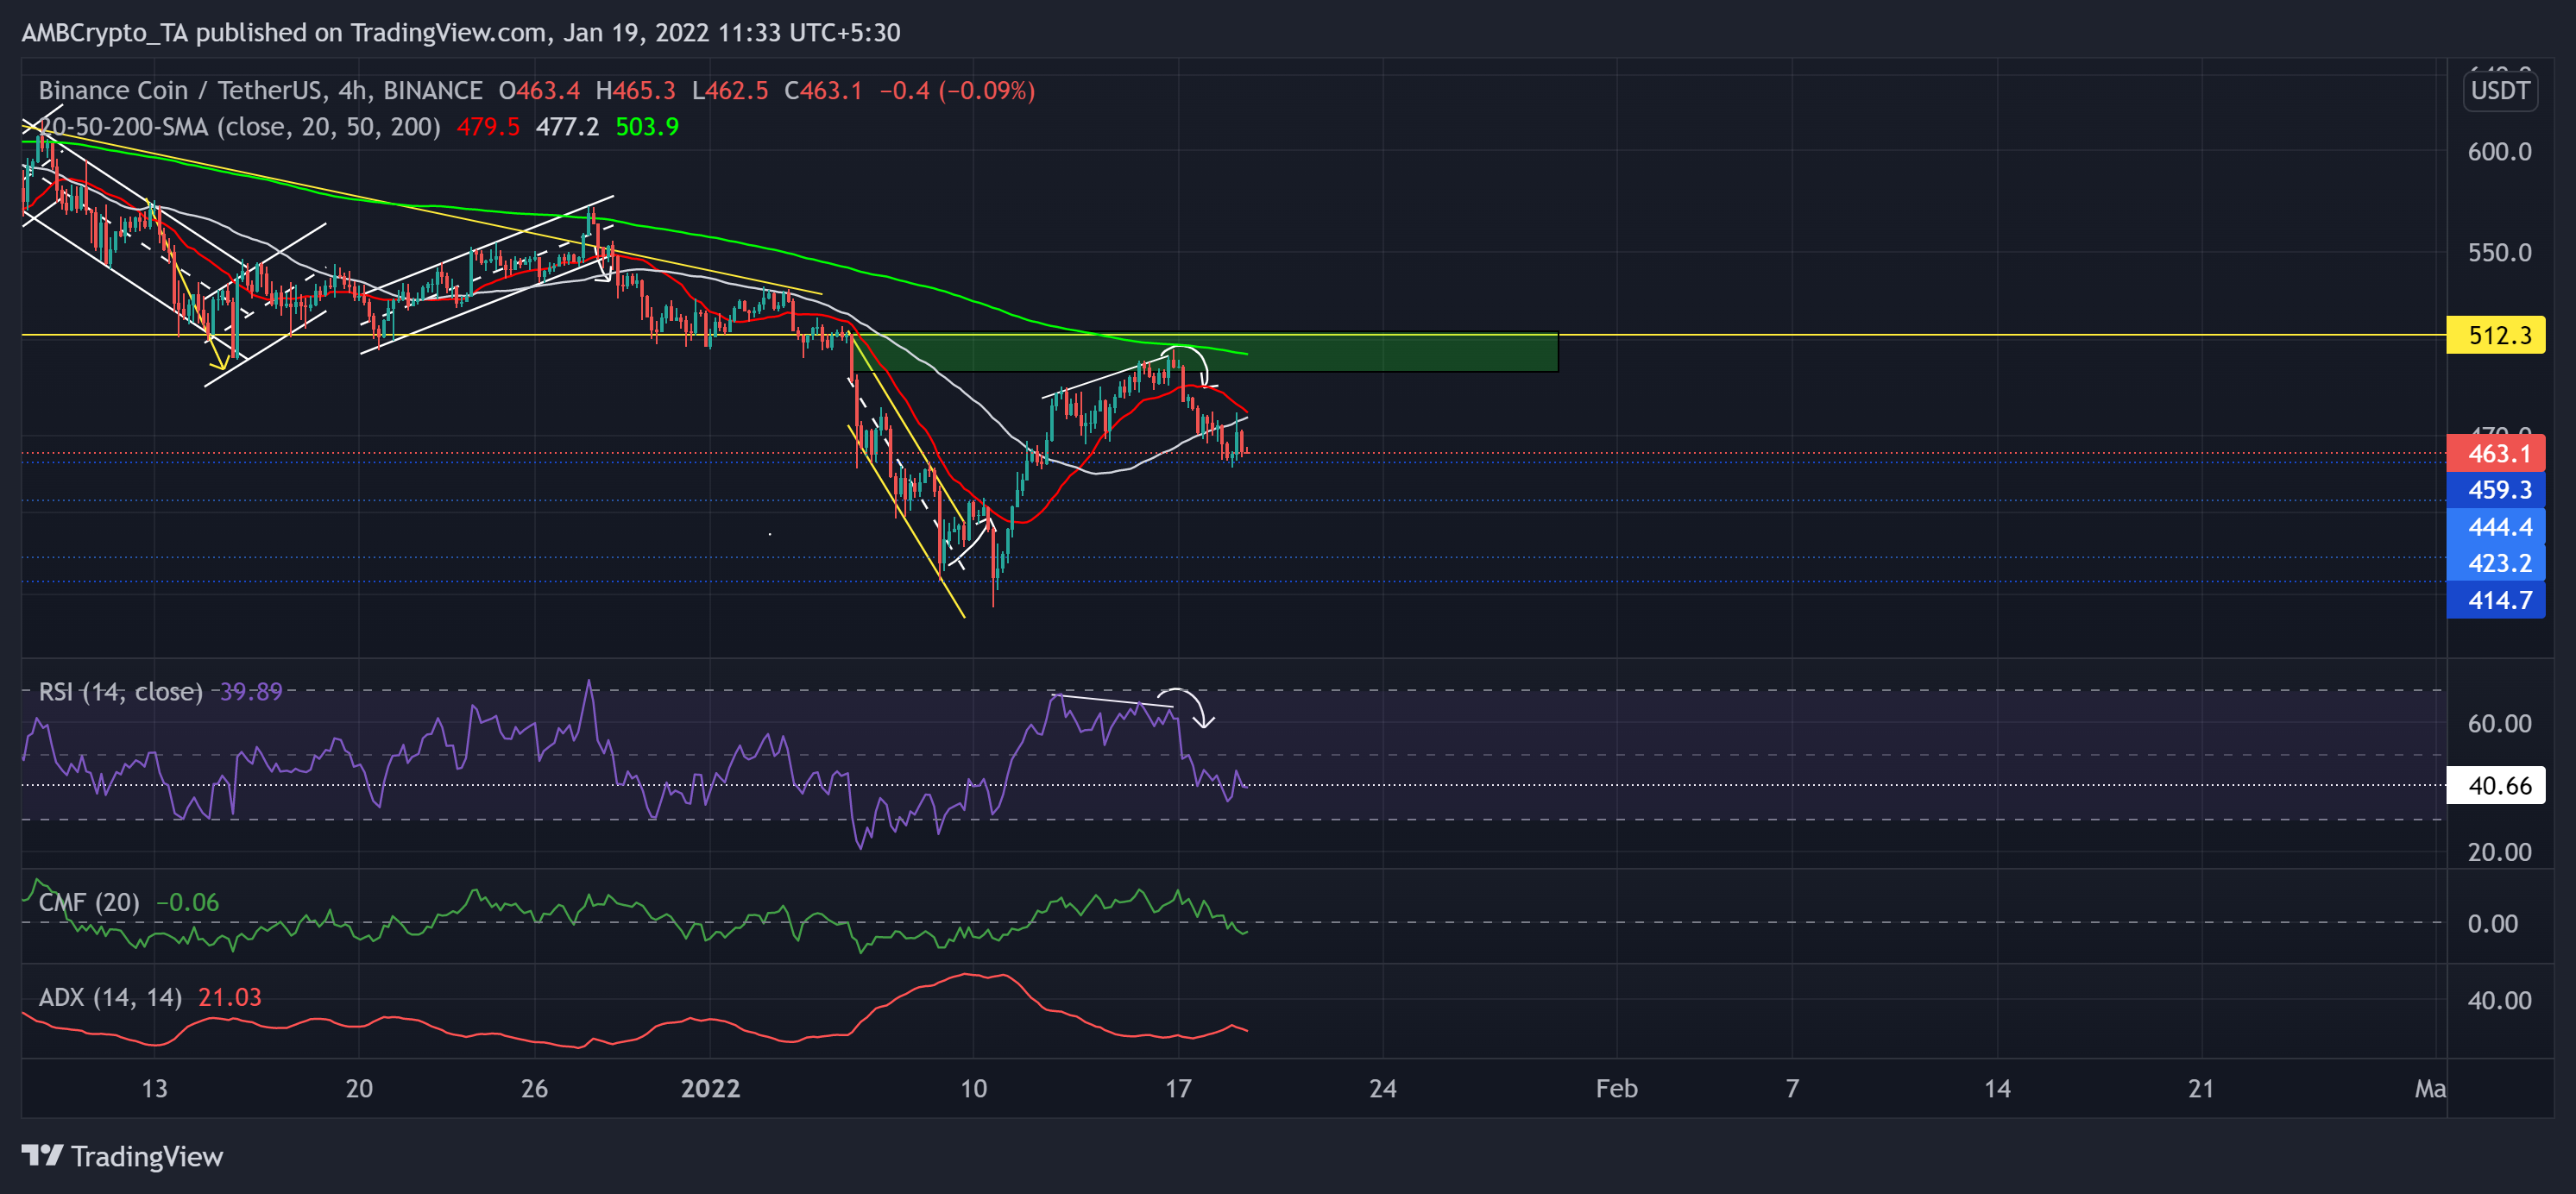
BNB lost 21.8% of its value (from 5 January) and poked its three-month low on 10 January. However, the alt rallied above its 20-50 SMA and recovered the previous losses. But, it saw a pullback from the 200 SMA (green) near the $500-zone supply zone (rectangle, green).
As the gap between the 20 SMA (red) and 50 SMA (grey) diminished, the selling influence seemingly increased. Now, the $459-mark is crucial for the bulls to uphold.
At press time, the alt traded at $463.1. After bearishly diverging with the price, the RSI plunged below the 40-mark. However, it managed to retest this mark again while moving sideways. Further, the CMF fell below the zero line, hinting at weak money volumes. Nonetheless, the ADX displayed a weak directional trend.
Ethereum Classic (ETC)
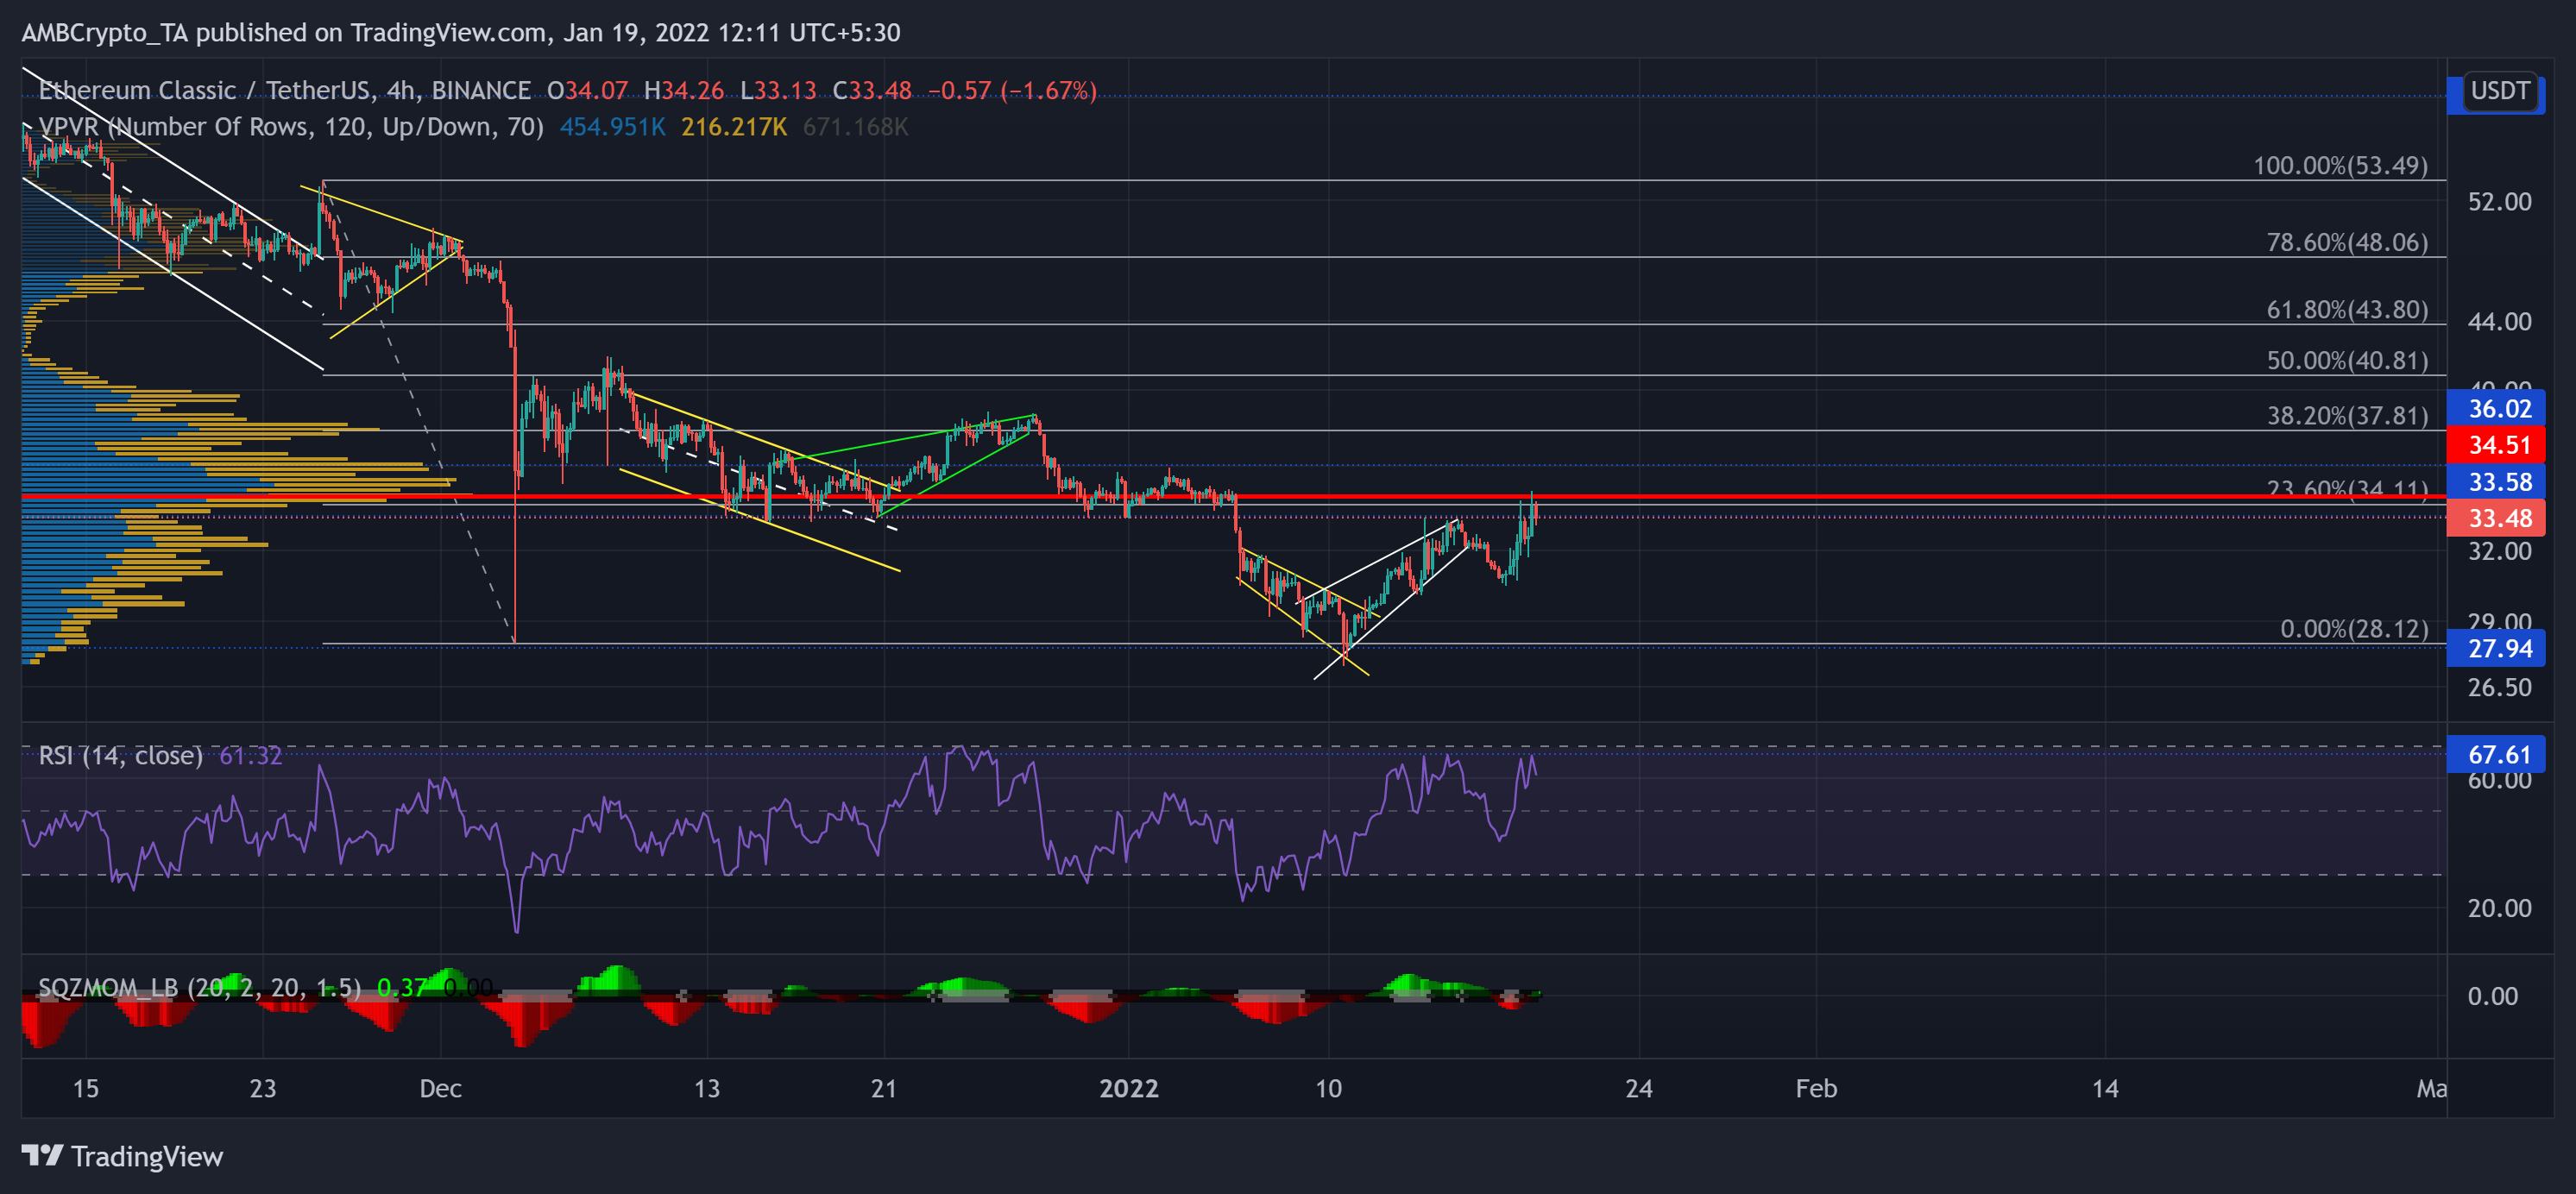
After briefly oscillating between the $36 and $33-range near its Point Of Control (red), ETC succumbed to a broader sell-off on 5 January. It marked a 29.8% correction (from 27 December high) until it poked its 37-week low on 10 January.
Then, after forming a descending broadening wedge (yellow), ETC managed to recover the recent fall but saw resistance at the Point of Control near the 23.6% level. Now, a close above $34.5 (Point of Control) would be necessary to confirm a strong rally.
At press time, ETC traded at $33.48 after gains of 6.6% over 24-hours. The RSI tested the 67-mark near the overbought region four times in the last five days. This reading depicted a strong buying force. On the other hand, the Squeeze Momentum Indicator flashed black dots, hinting at a low volatility phase.
EOS
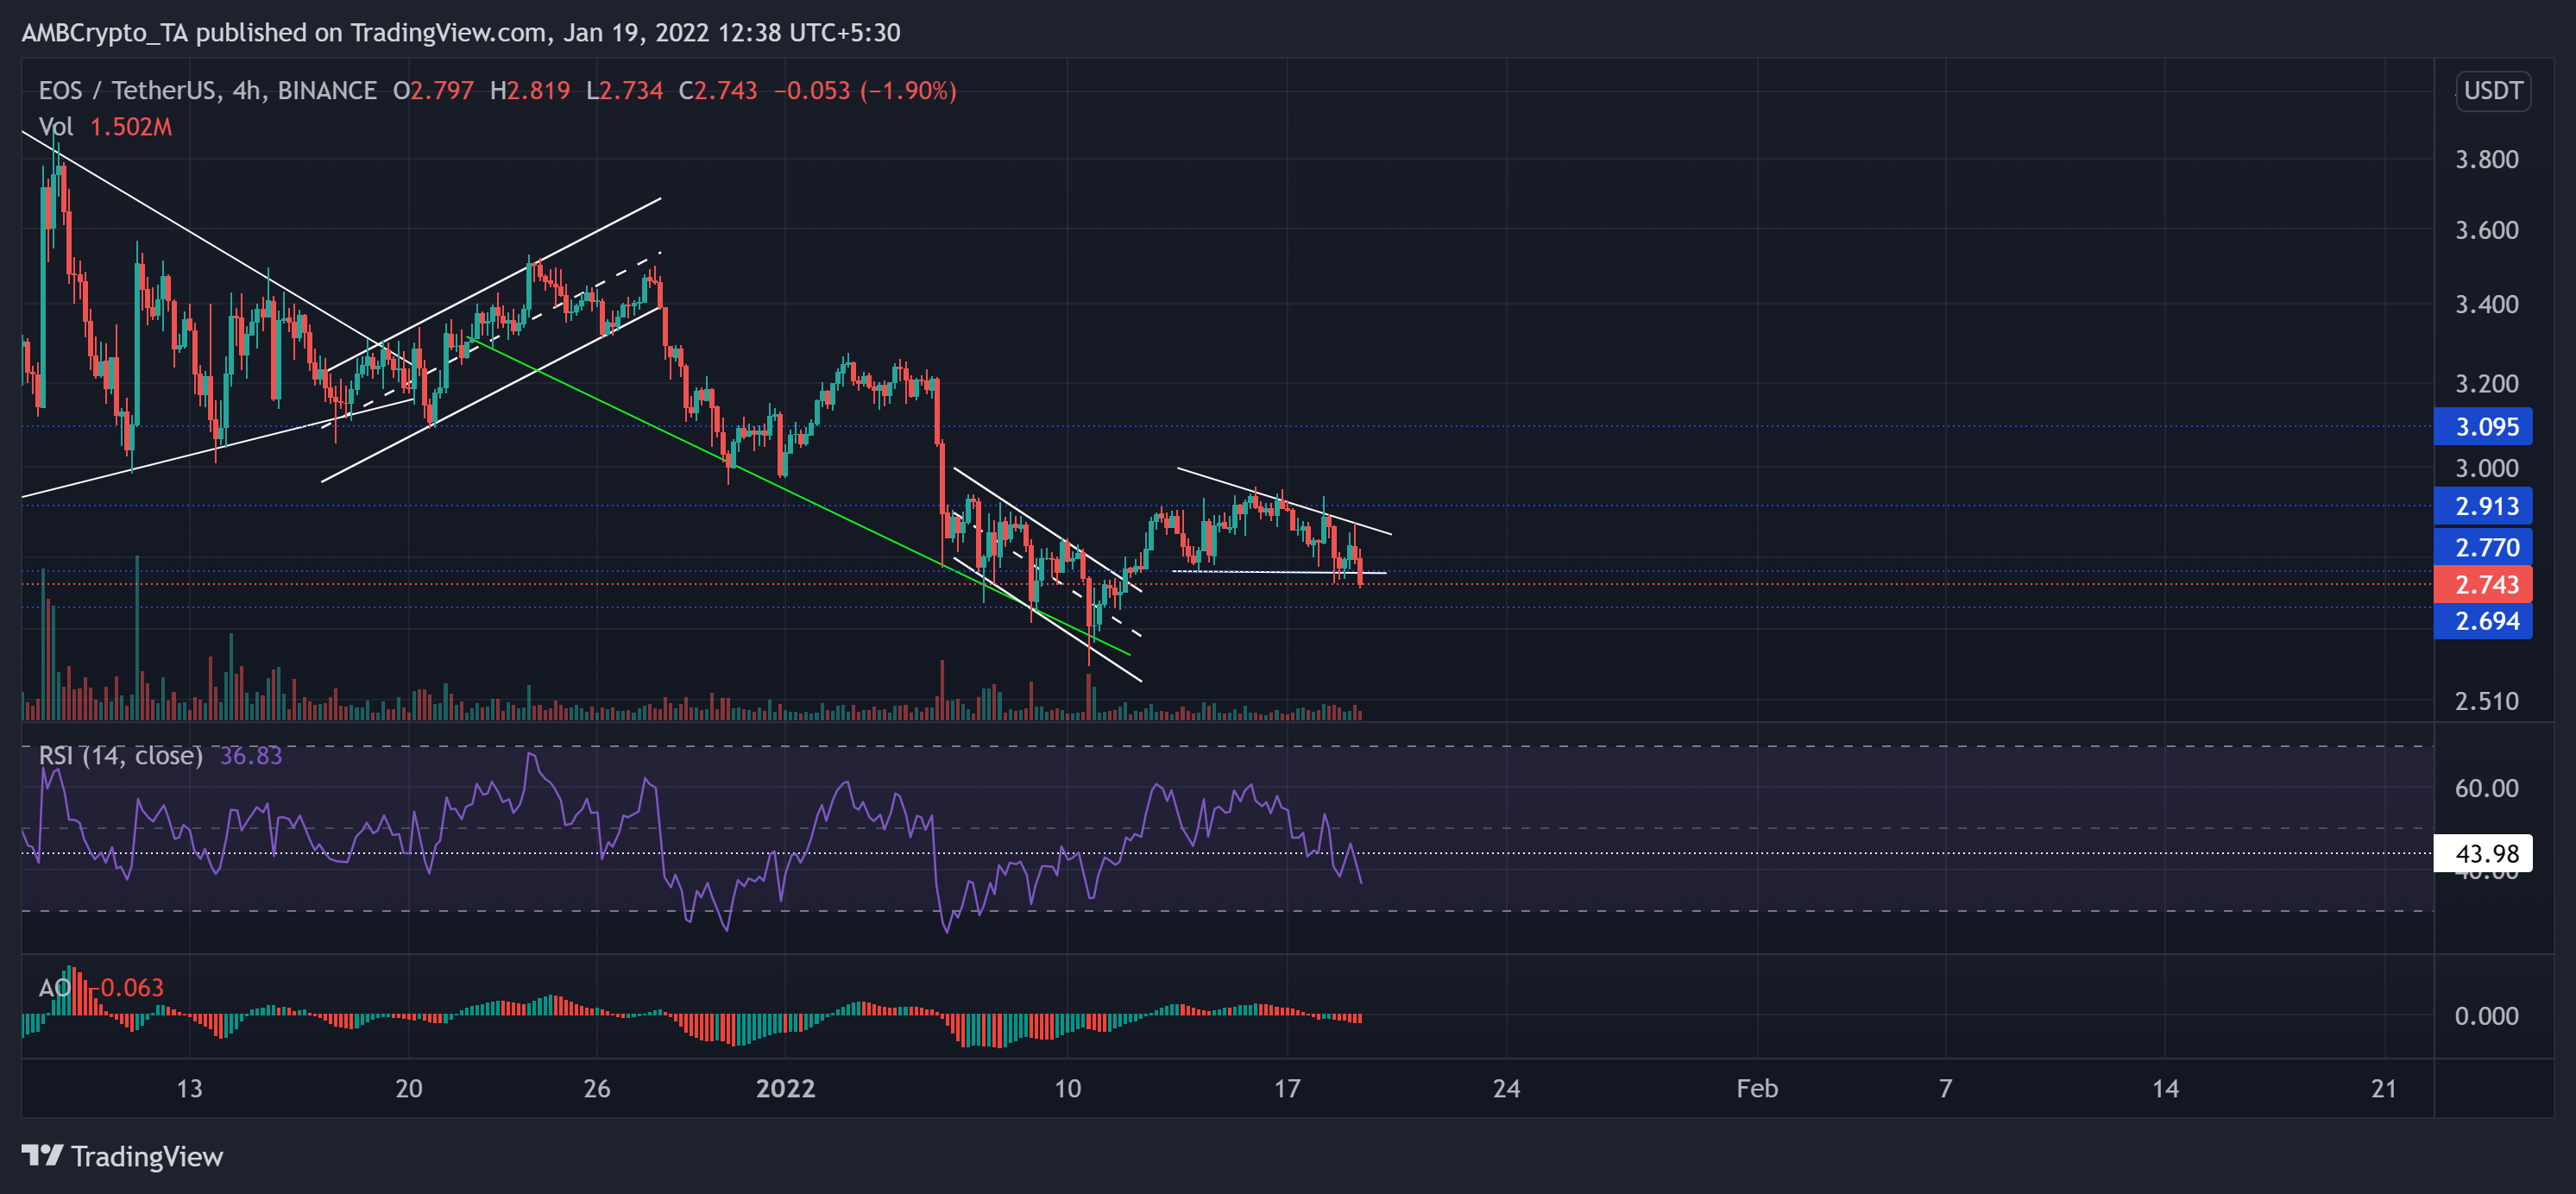
With a 19.9% retracement (from 5 January), EOS poked its five-week low on 10 January. Since then, EOS marked an over 14.7% recovery after breaking out of the down-channel (white).
As the buyers failed to step in at the $2.9-zone, the bears flipped it to immediate resistance. In the recent past, the alt marked lower peaks while maintaining the $2.7-level. This trajectory depicted an increased selling influence.
At press time, EOS was trading at $2.743 after falling below the vital $2.7-mark. The RSI was southbound after losing the 43-level support. Unless the buyers step in to initiate a reversal, the RSI eyed to retest the oversold region. Also, the AO fell below equilibrium after marking lower troughs and asserting a bearish bias.


