Solana is trading within a range, but here’s what you could be missing

Disclaimer: The findings of the following analysis are the sole opinions of the writer and should not be considered investment advice
Solana has traded within a range over the past couple of weeks, a range that is yet to be broken. Recently, a Coinshares report noted that Solana has been a favorite of investors, having seen $5.4m inflows in total for the previous week alone.
There has been some clamor on social media, with people claiming that Solana would replace Ethereum in the years to come, even though the network has faced some congestion issues recently. Some caution must be exercised by long-term buyers as the longer-term trend has been downward, with the recent range being the latest consolidation in price action.
SOL – 1 hour chart

Source: SOL/USDT on TradingView
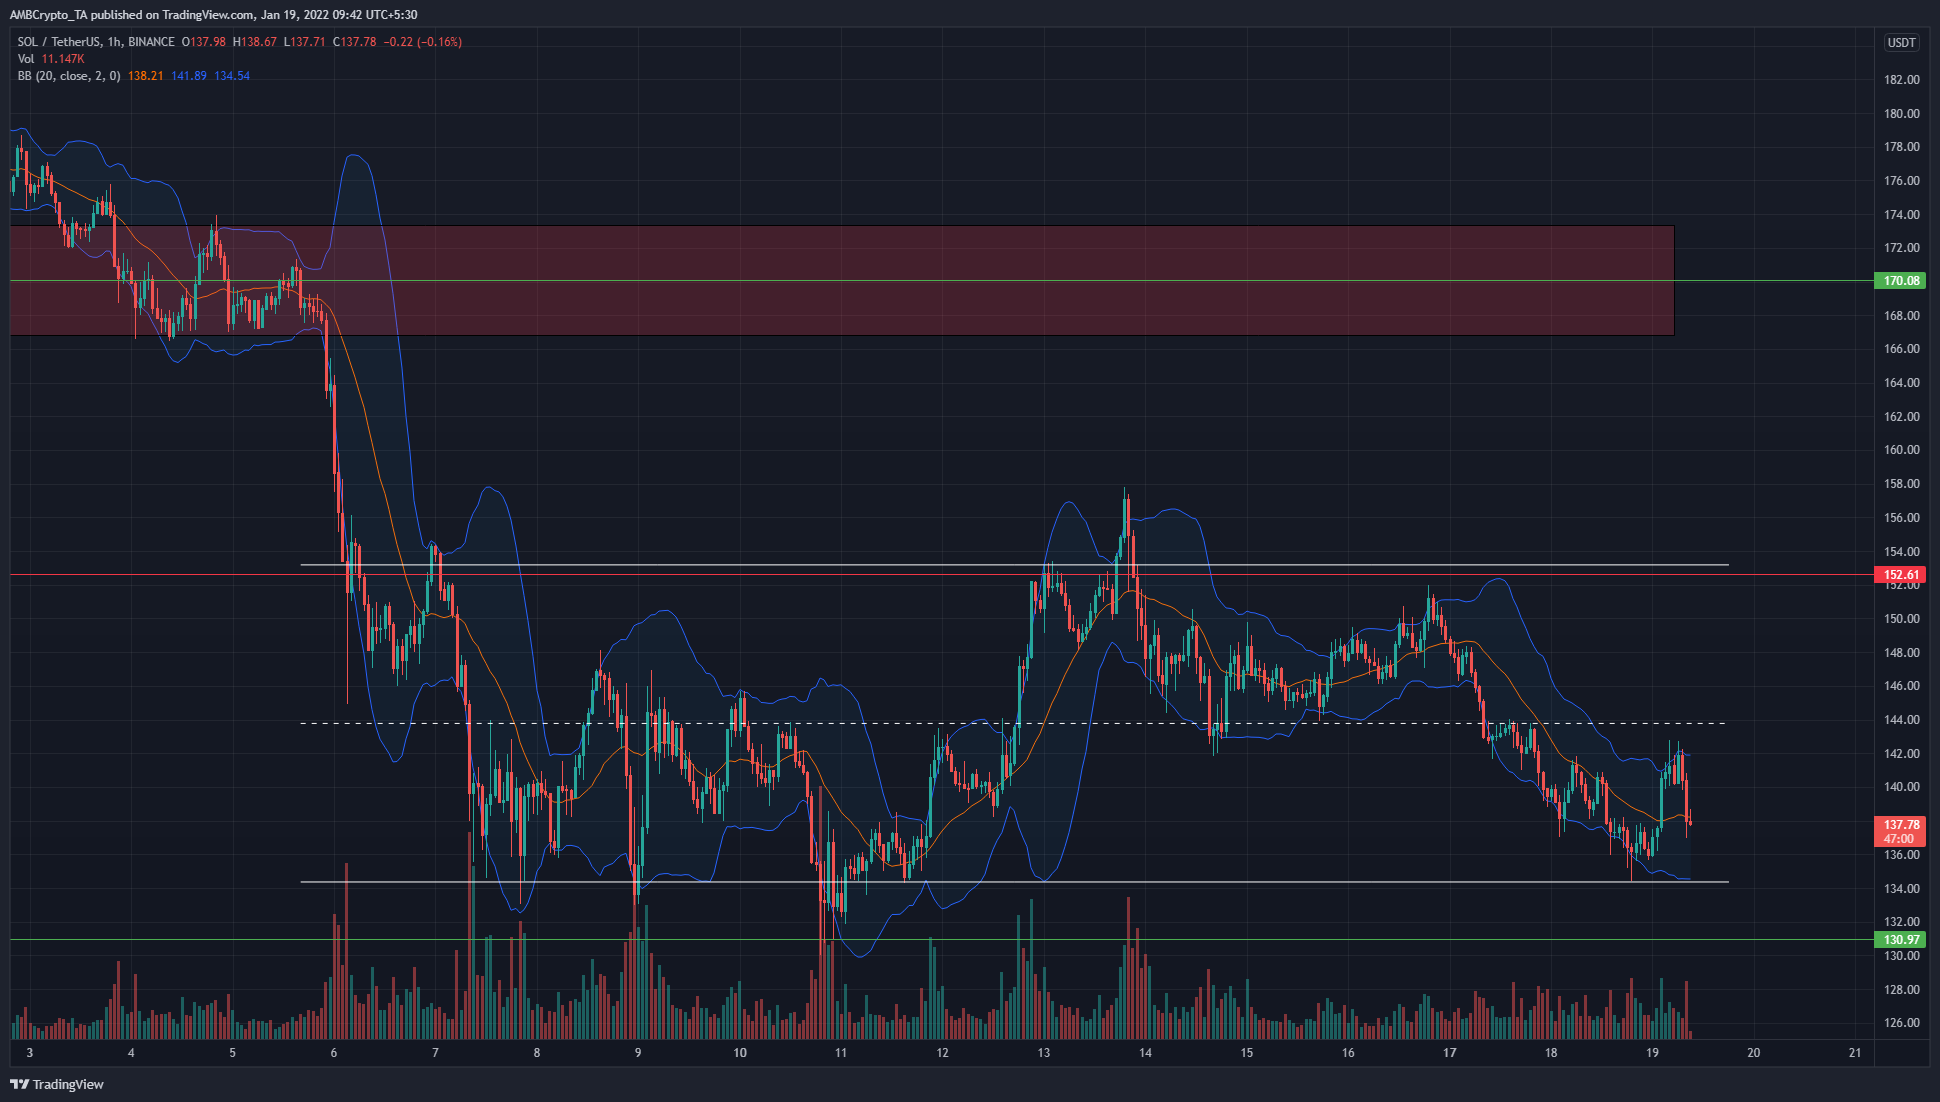
On the hourly chart, the price formed a range between the $134 and $152 levels. Occasionally, the price has stepped beyond these bounds in search of liquidity, but this is not unusual. After a strong trend such as the downtrend in recent weeks for SOL, this could be an accumulation phase.
It could also be some consolidation before the next wave of selling. Therefore, until the market structure changes and a trend is established, these range lows and highs can be looked at as buying and selling opportunities. The mid-point of this range lay at $144 and has also been a significant level in the short-term.
The $130-level has been a longer-term significant level and was tested as support last week.
Rationale

Source: SOL/USDT on TradingView
The Aroon Oscillator showed that the trend had switched from bullish to bearish multiple times in the past couple of weeks. This frequent change in direction was something generally seen within a range, as trending markets have a period of pullback followed by more sustained periods of the prevailing trend.
The Bollinger Bands were not tight to the price, even as the Bollinger Band width indicator was on the rise over the past few days. This suggested that there has been volatility recently behind SOL’s price.
The Awesome Oscillator pictured weak bullish momentum as it was above neutral zero. This was due to the sharp bounce SOL registered after a test of the range lows, nearly reaching $144 in that move.
Conclusion
The range lows in the $134 area can be considered short-term buying opportunities, while the highs near $152 are for selling. Until SOL sees a breakout past this range, the highs and lows would represent the liquidity the price gets pulled towards.


