
Over the past couple of days, Bitcoin‘s Dominance metric has been on the rise. Alongside the same, Bitcoin has also been making steady gains after hitting a local bottom of $37.3k.
The altcoin market reacted positively to Bitcoin’s gains as Binance Coin broke out of its short-term range and Ethereum Classic rose past its resistance level. Finally, Waves noted a retracement on the charts.
Binance Coin (BNB)
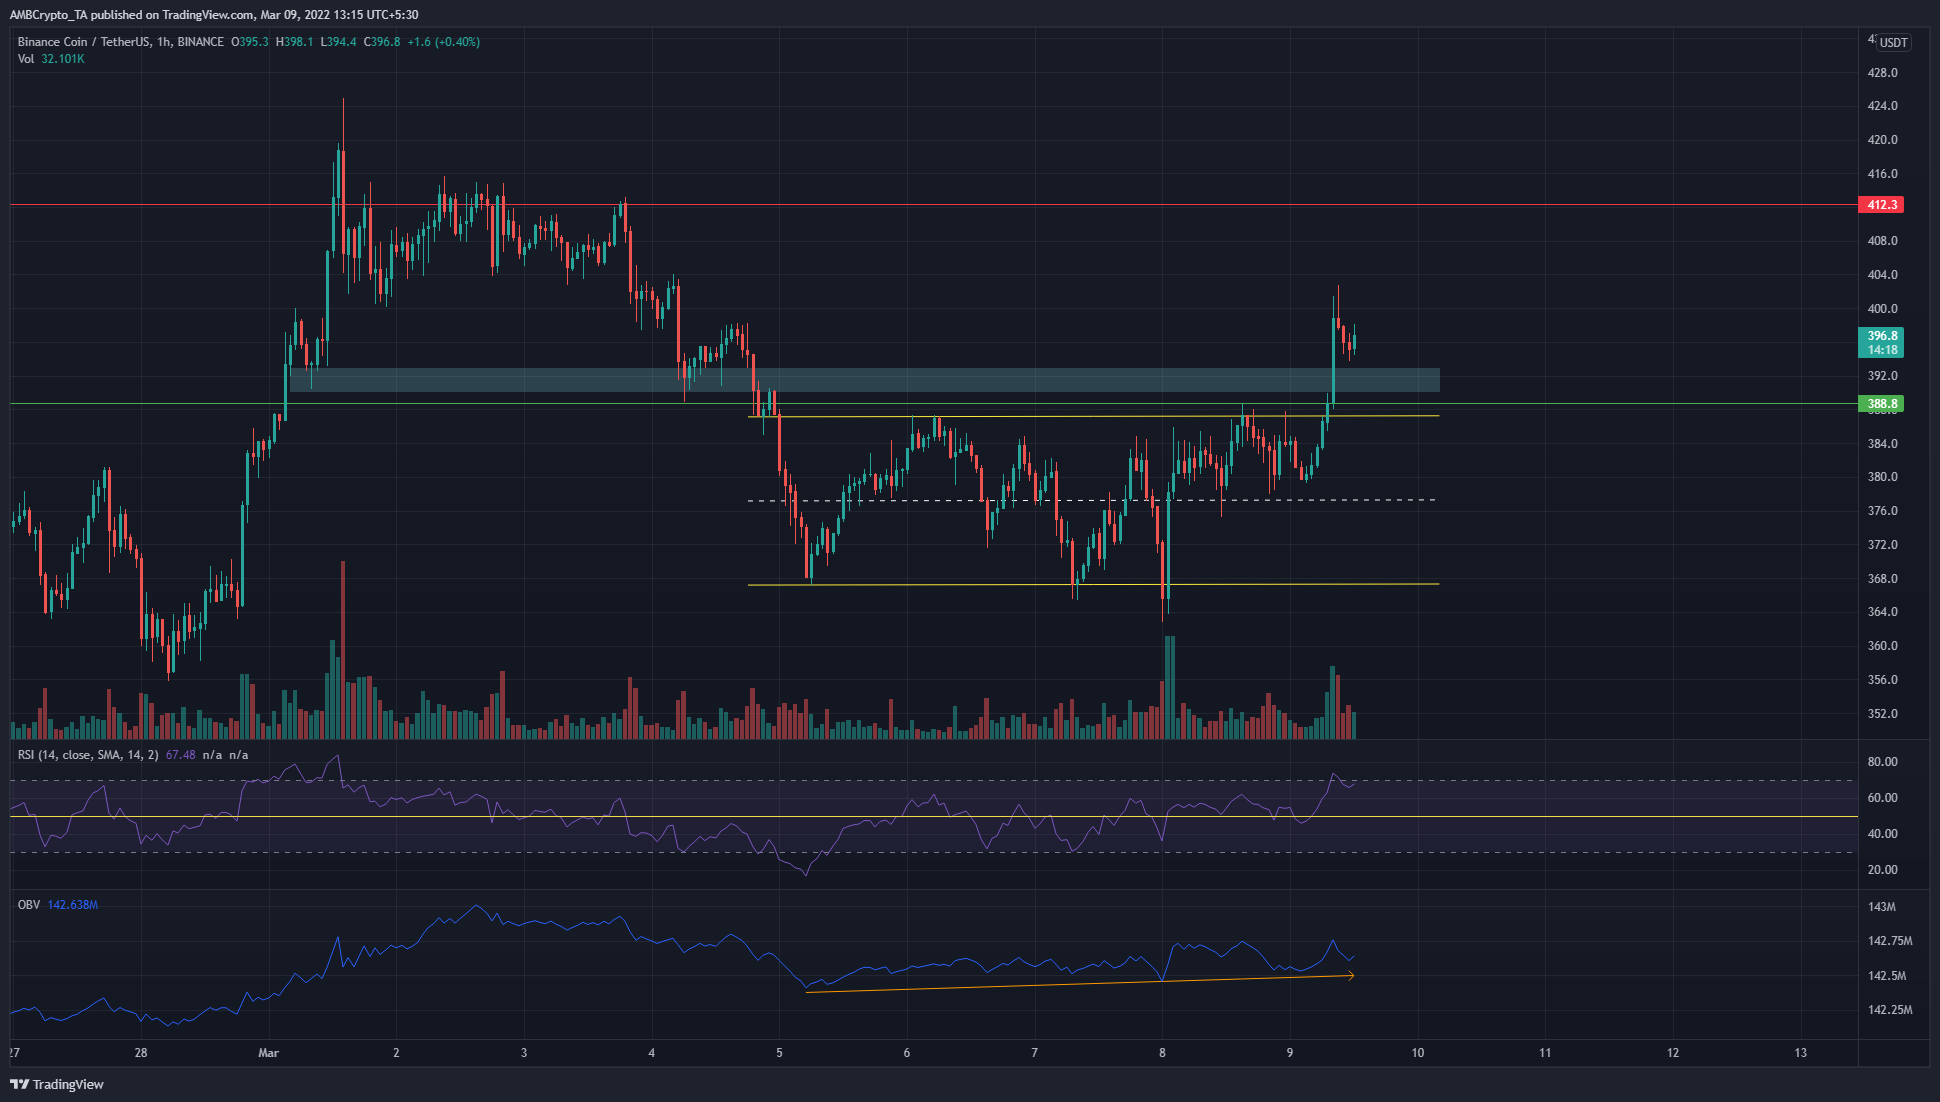
Source: BNB/USDT on TradingView
Over the past few days, BNB formed a range between $367 and $387. A couple of times the price dipped beneath the range lows but found some demand on each occasion. At the time of writing, the price had broken out of the range highs.
The $392 area (cyan) was broken in a single session and the price could revisit this area to collect liquidity before its next move higher. The RSI, which had been indecisive about the neutral 50 line recently, has surged of late too.
The OBV has also been making a series of higher lows in recent days to show rising demand.
Ethereum Classic (ETC)
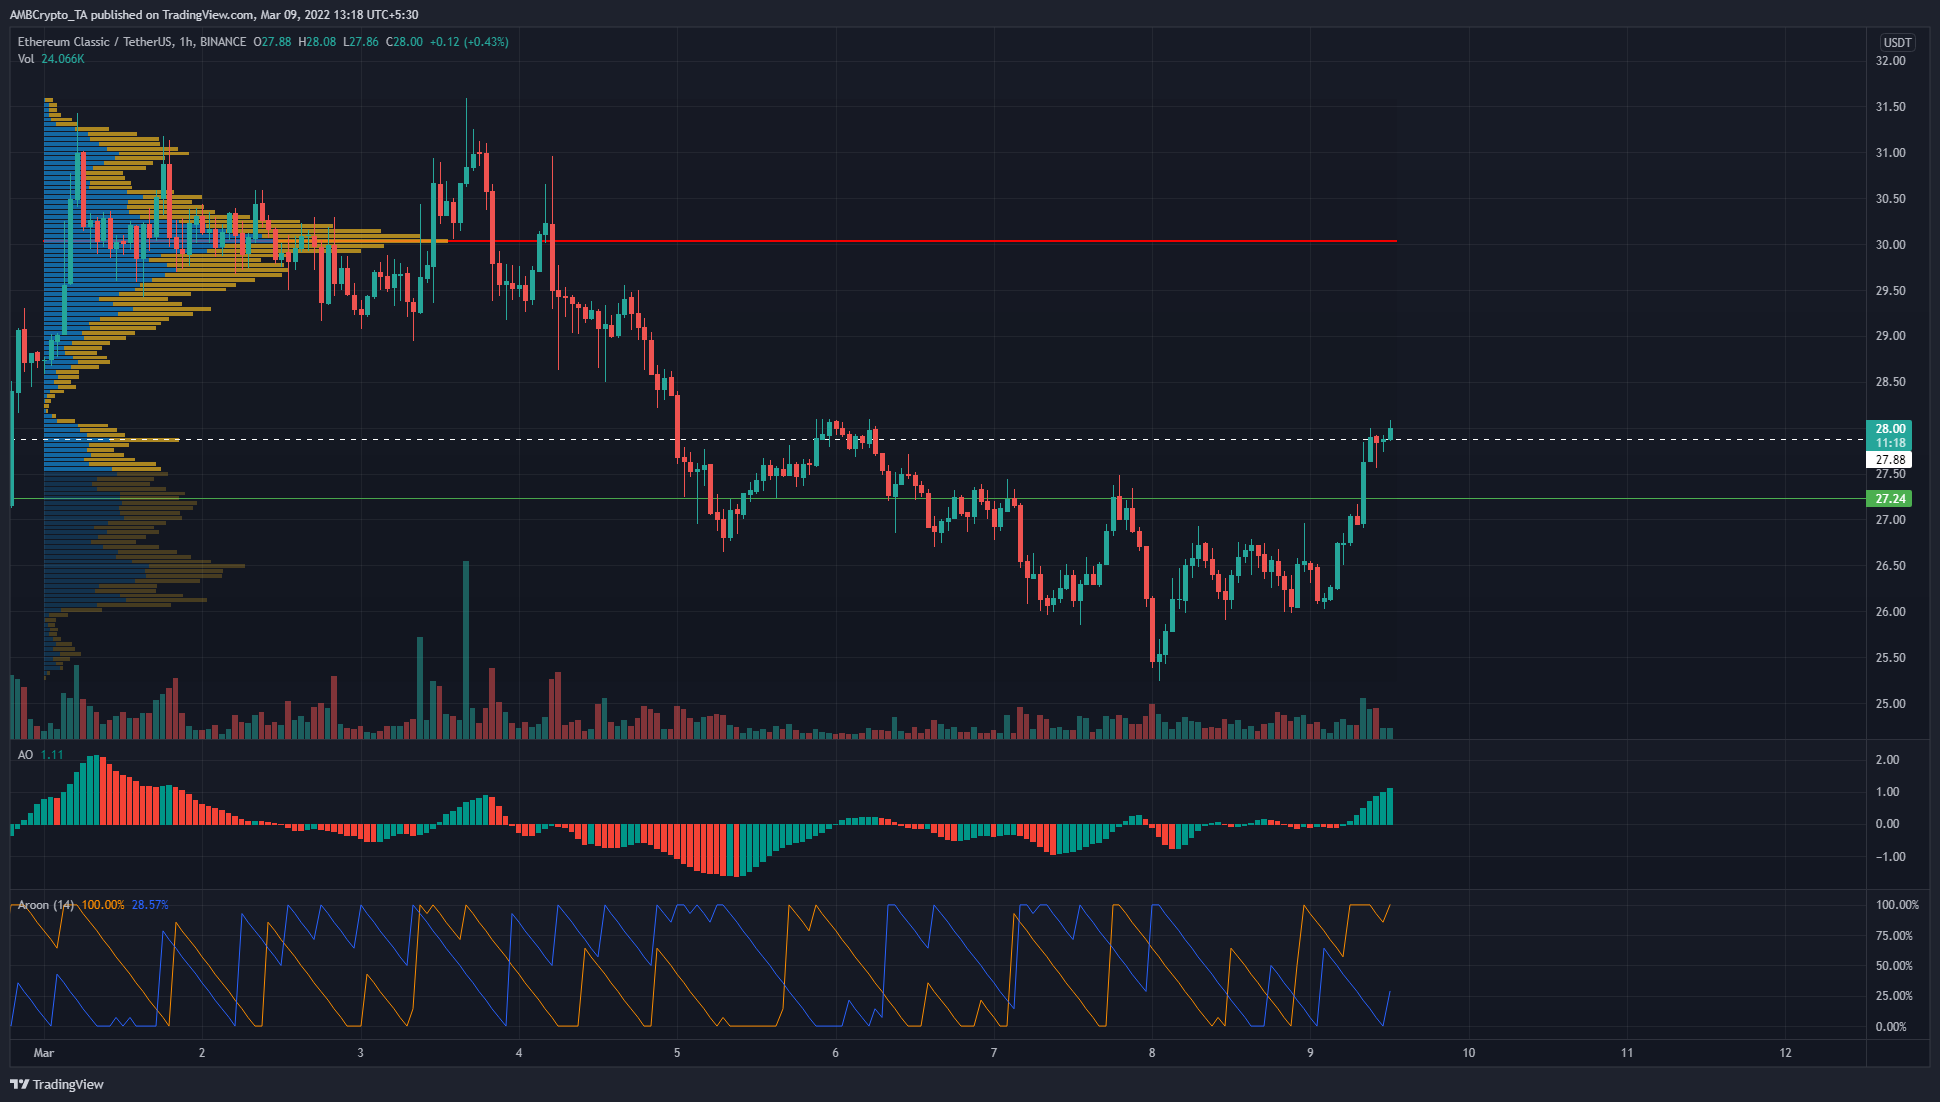
Source: ETC/USDT on TradingView
A Fixed Range Volume Profile plotted for ETC in March showed that the Point of Control lay at $30. This represented a strong resistance level. Like many other coins, the past few hours have seen ETC break above the resistance level at $27.2.
The FRVP also showed that ETC was trading in the Value Area once more and succeeded in rising above the $27.8 node. The next resistance for ETC lay around the $29 and the $30-area. The Awesome Oscillator flashed strong bullish momentum. Finally, the Aroon indicator noted that an uptrend could be in play, with Aroon Up strong on the charts.
Waves (WAVES)
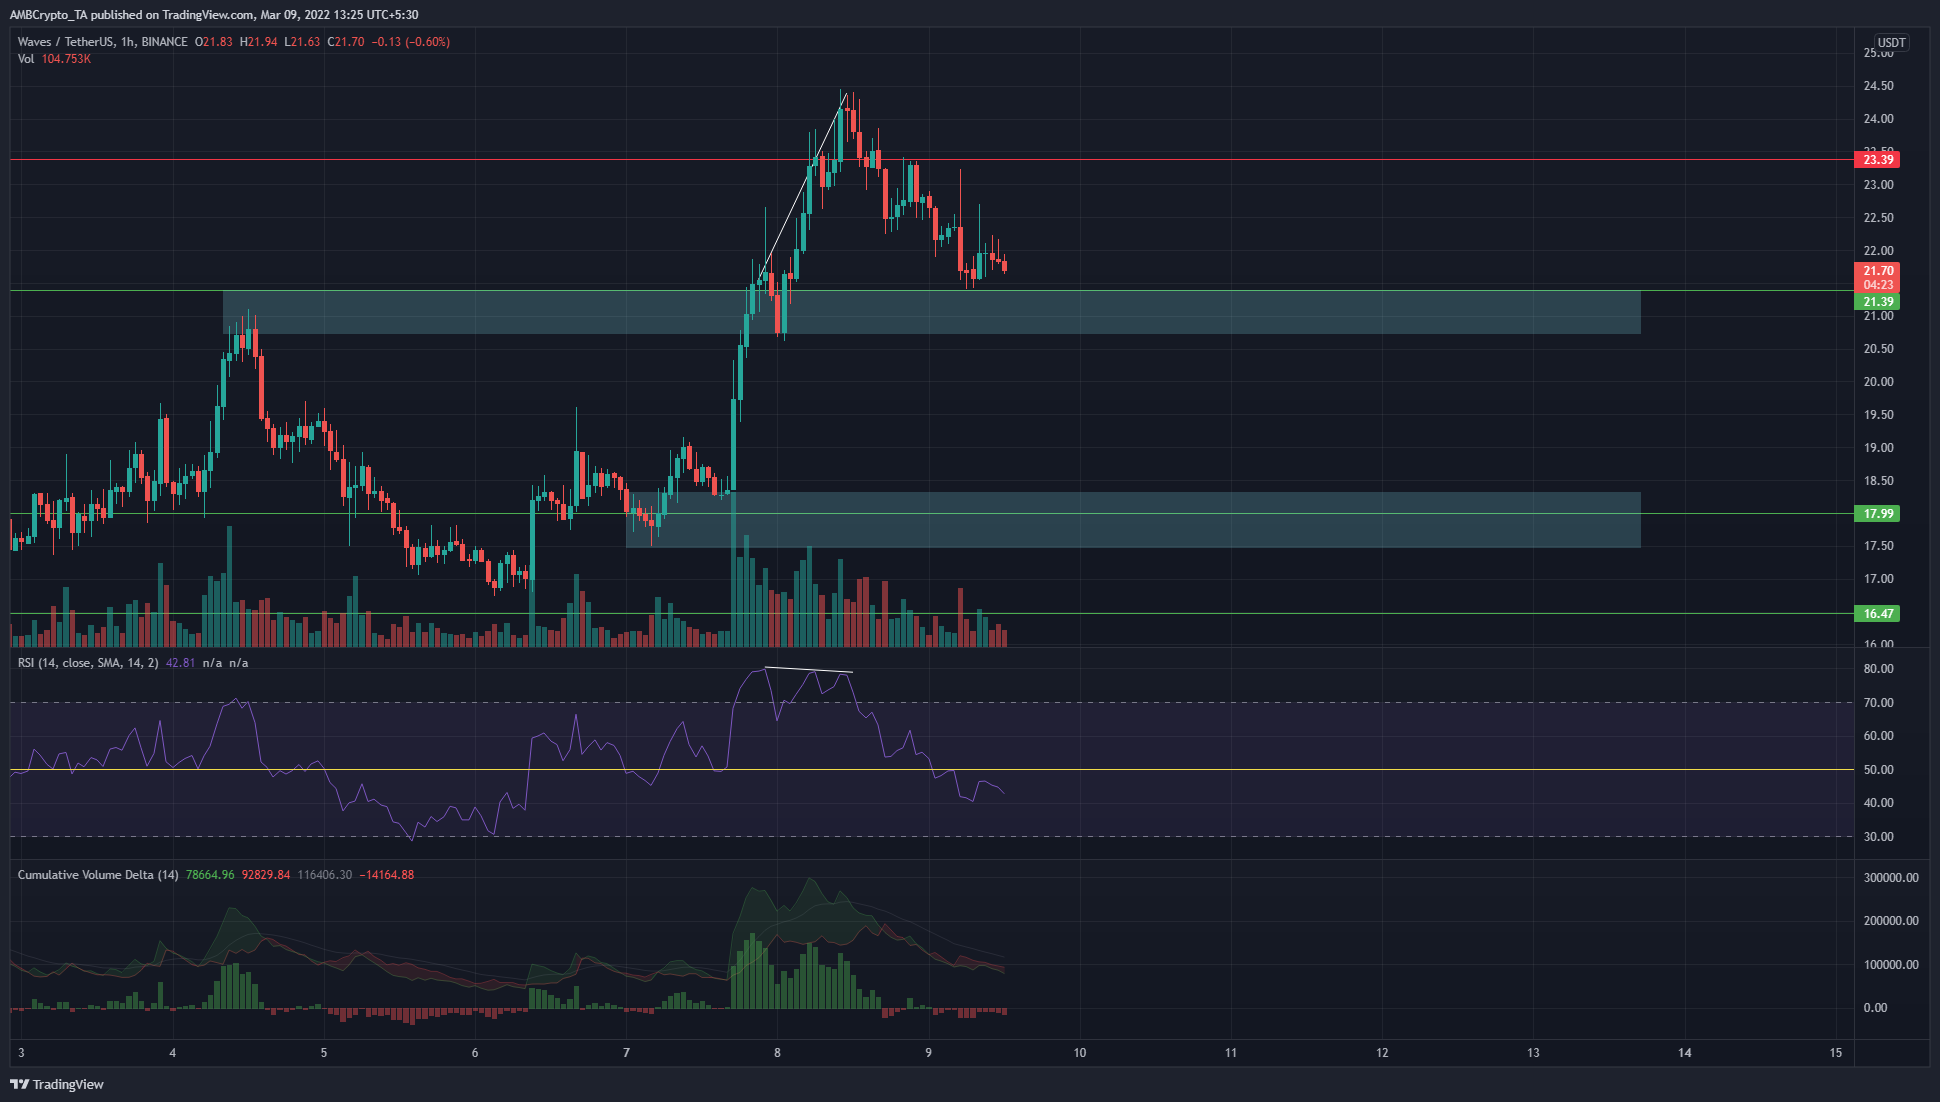
Source: WAVES/USDT on TradingView
WAVES has been on a strong run over the past two weeks, having climbed quickly from its $8.5-lows in late February. At the time of writing, WAVES was above the $21 demand area (cyan box). To the upside, resistance lay at $23.39, $24.6, and $26.03.
The previous day, a bearish divergence (white) was seen between momentum and price, and subsequently, the $21.4 support level was tested. Waves could head higher once more and waiting for the CVD to flip green could signal demand had arrived. The RSI stood at 42.8 and would need to move back above neutral 50 for the next leg upward.