Binance Coin, IOTA, Dogecoin Price Analysis: 06 January

Binance Coin and Dogecoin entered a consolidation phase on the price charts after a solid start to the year, while IOTA projected upside movement as buyers took control of the market.
Binance Coin [BNB]
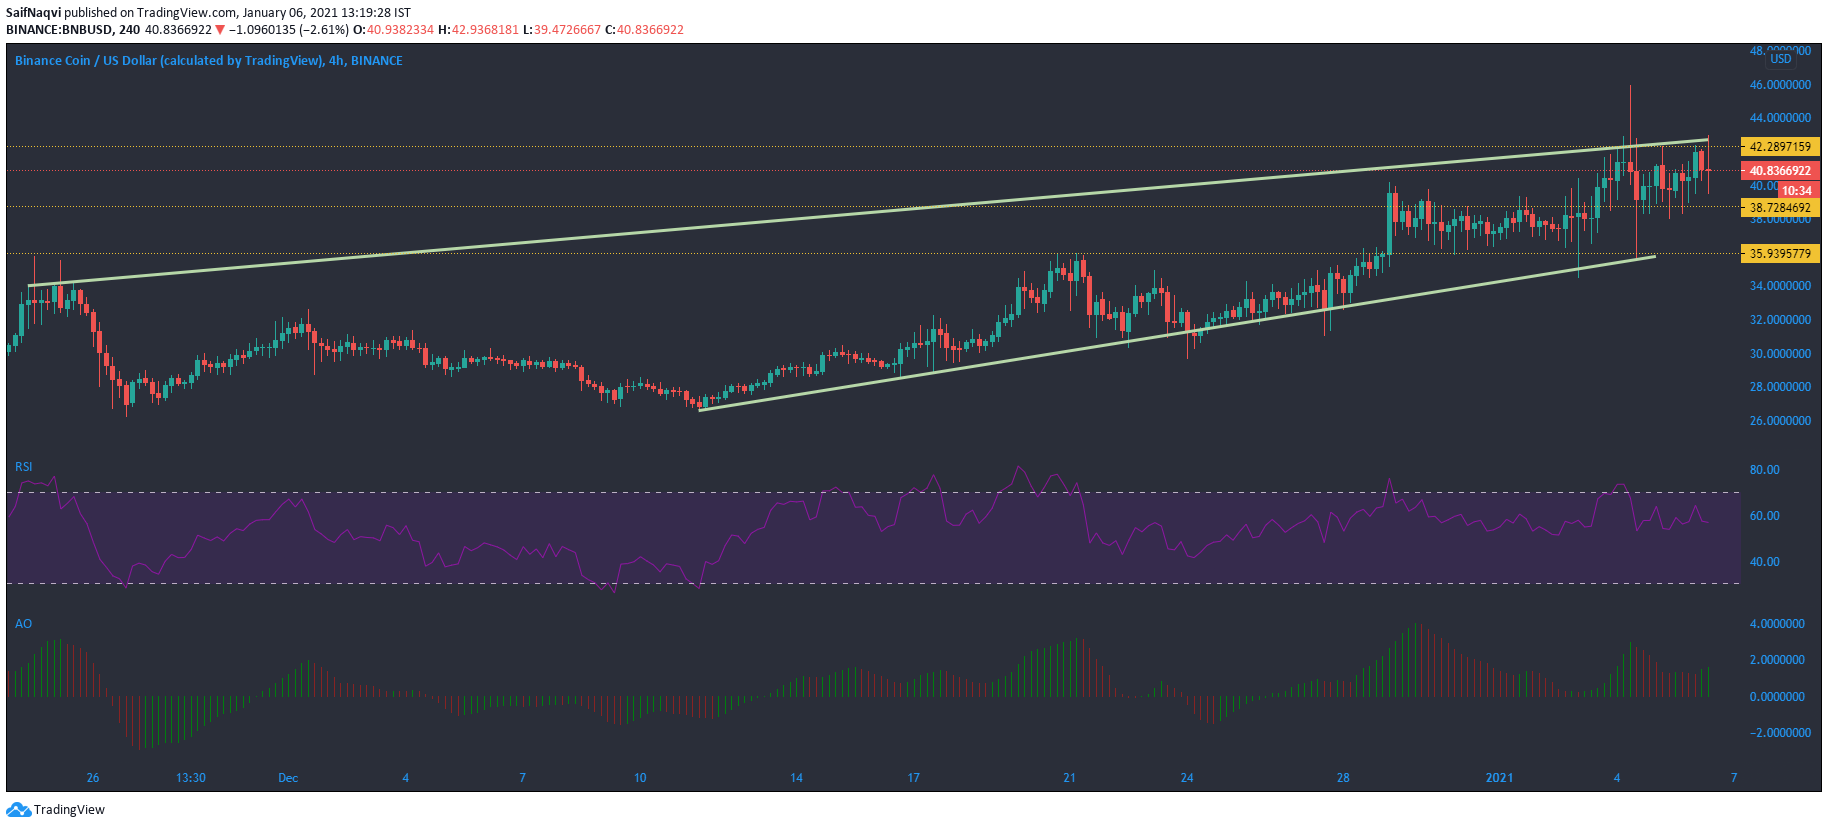
Binance Coin seemed to be noting a minor pullback after breaching its all-time high a couple of days back. Since then, the cryptocurrency’s price has consolidated between $42.28 and $38.7 as buying pressure prevented the price from falling below this channel. The next few trading sessions could see the price move within this channel before a breakout occurs.
The Relative Strength Index was looking to stabilize slightly above the neutral zone, with the same exhibiting bullish-neutral characteristics.
The Awesome Oscillator also highlighted the slightly bullish nature of the price as the green bars remained steady above zero. On the flip side, if the bears manage to take control of the market, the price could fall and test the support at $35.93.
IOTA

IOTA’s 4-hour chart depicted the skirmish between the market bulls and bears over the past three days. While buying pressure lifted the price above several resistance levels, sellers stepped in and tried to pull the price lower on the charts.
At the time of writing, IOTA was trading at $0.372, up by 17% in the past 24 hours as the bulls regained control of the market. Judging by the price action over the past few days, IOTA could continue its upward momentum before a pullback occurs.
The Stochastic RSI was heading towards the overbought zone, a bullish sign for the price. However, a pullback could be on the cards if the index shoots downwards after trading in the upper region. A southbound move could see the price move towards the support at $0.342.
The Chaikin Money Flow showed that capital was moving into the cryptocurrency as the index was rising above the point of equilibrium.
Dogecoin [DOGE]
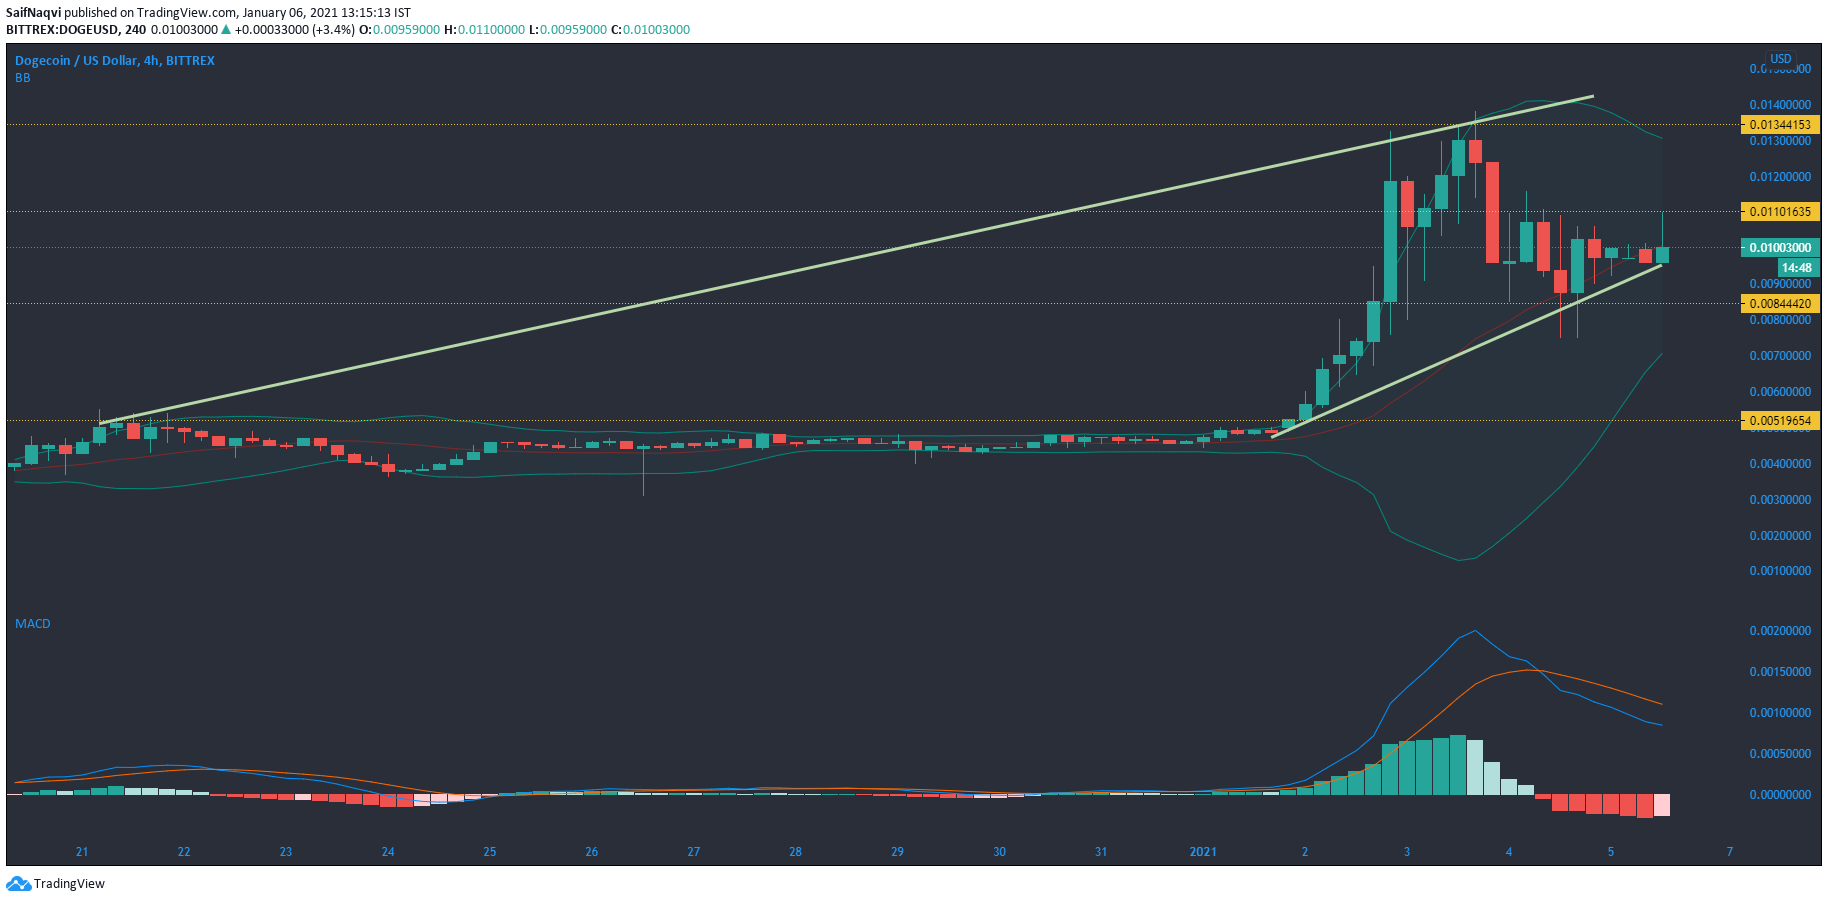
While Dogecoin had a rather subdued end to the year, the price shot upwards when 2021 began. In the last seven days, the popular ‘meme coin’ rose by an astounding 133.3%, solidifying itself among the biggest weekly gainers. While DOGE was nearing its 2017 all-time high, the price cooled down after reaching the resistance at $0.013 and moved lower towards the $0.008-mark. Finally, the indicators suggested that the price might continue to consolidate between the aforementioned channel.
While the MACD was bearish, the histogram registered a slight drop in the bearish momentum, suggesting that the price could remain between $0.011 and $0.008.
The Bollinger Bands underlined the minor pullback as the crypto’s price moved towards the average line after trading on the upper band. A reversal was not quite a possibility, unless the candlesticks touch the lower band.


