
The altcoin market, after noting a considerable uptick in the last two days, saw a slight fall in market cap by 4%. Binance Coin, the fourth-ranked crypto on CMC, registered steady gains before its price started dipping on June 15. A similar trajectory was plotted by IOTA. Finally, MATIC showed signs of weakening too as its price fell by almost 8% on June 15.
Binance Coin [BNB]
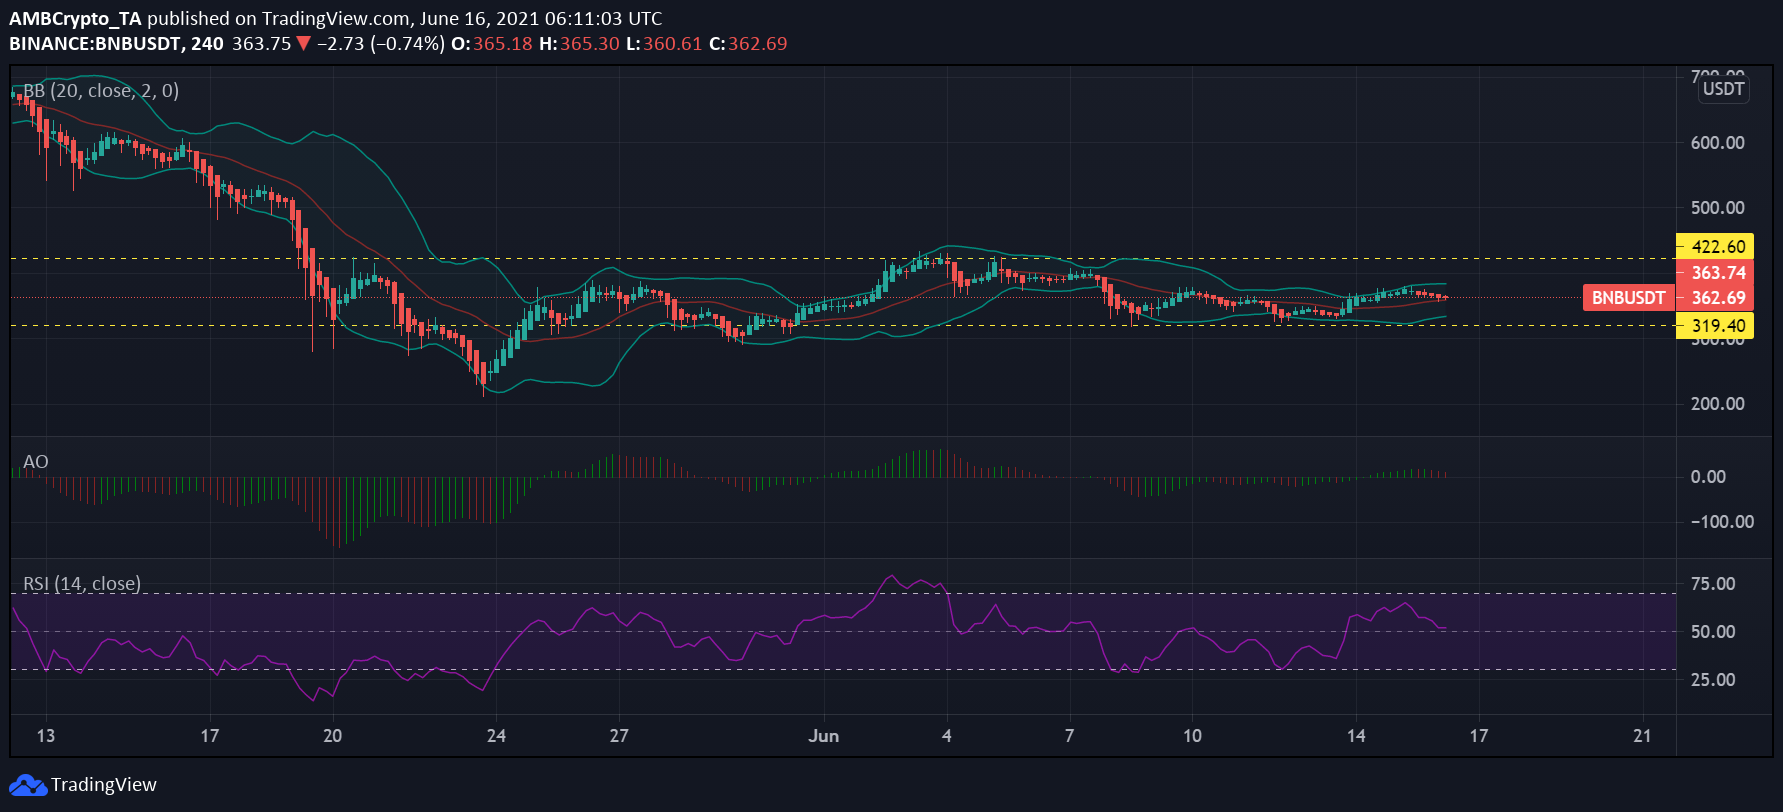
Source: BNB/USD – TradingView
BNB was trading at $362.64, at press time, and was down from its ATH by 46.81%. BNB has traded within its closed channel since the May 19 drop, occasionally testing its support at $319.4. The coin’s key resistance was at $422.6, at the time of writing.
The Bollinger Bands for the asset highlighted a parallel trend, one underlining a restricted price range and volatility. Binance Coin’s 30-day volatility was 2.18. Further, the Awesome Oscillator for BNB highlighted that bearish momentum had crept in with a slight rise of red bars above the zero-line. Receding red bars (in length) if the price movement continues south would take the asset in a more dominant bearish zone.
The Relative Strength Index (RSI) noted a reading of 52.2 at press time and was in the neutral zone. Since the indicator maintained itself above the 50-mark, it pointed to more dominant buying pressure in place.
MATIC
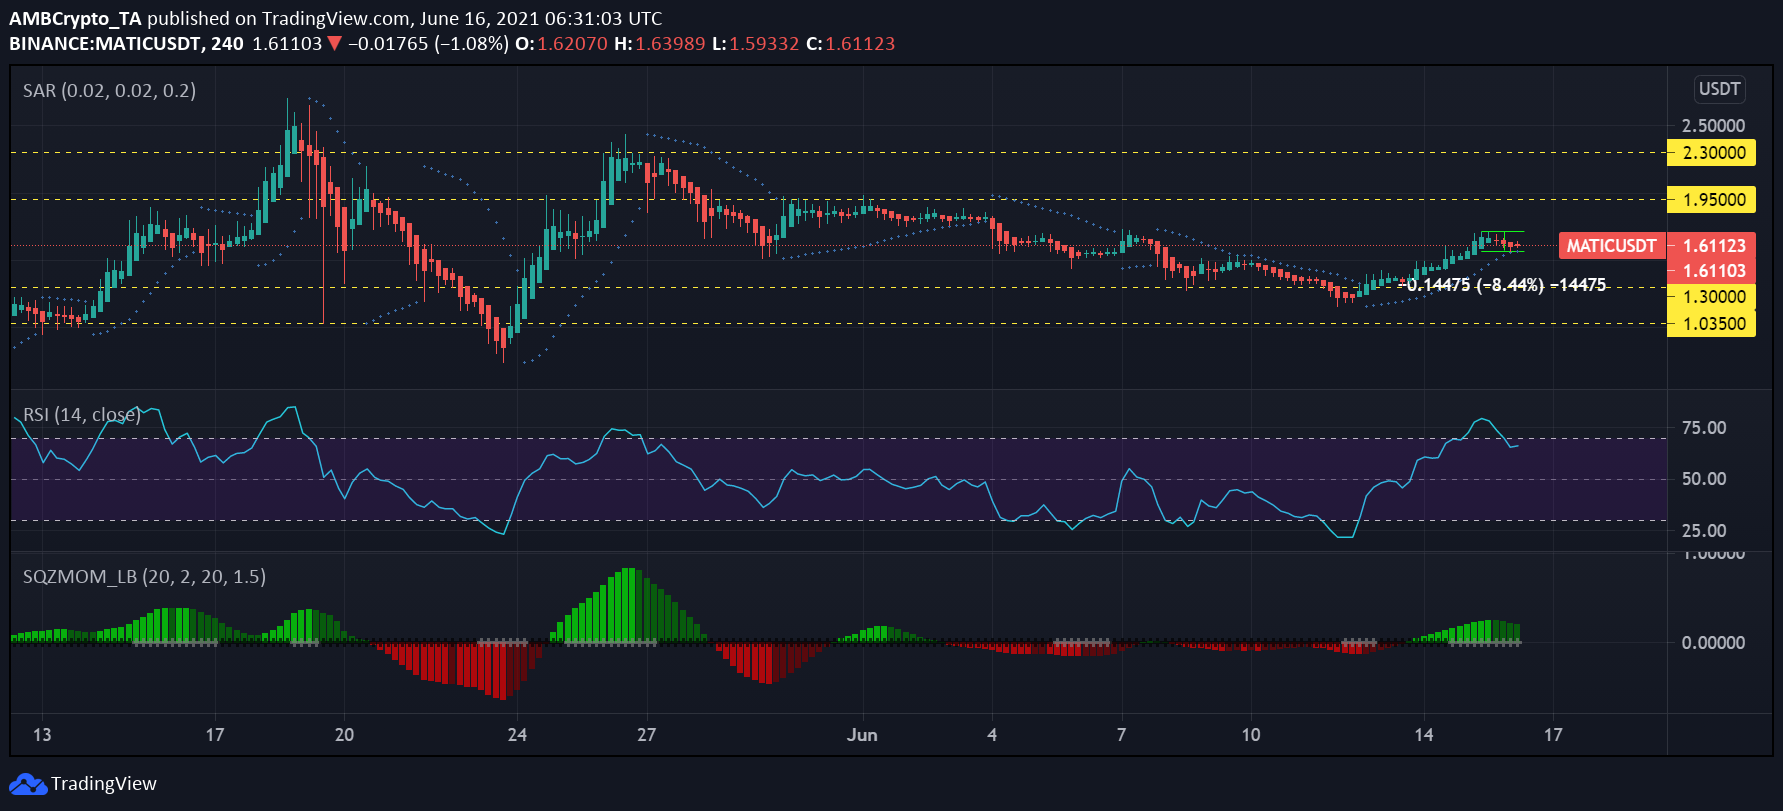
Source: MATIC/USD – TradingView
MATIC’s growing popularity has left many contemplating when to enter the alt’s market. Post the May 19 price drop, MATIC registered a fair recovery as the asset was down only by 36.12% from its ATH 28 days ago, at press time, with a breakeven multiple of 1.57.
On the back of a 7-day price rise of 14.74%, a price uptrend initiated bullish momentum on the charts, as depicted by the Parabolic SAR since the dotted line remained under the candlesticks. However, on 15 June, its price did drop by 8.4%.
Further, the Squeeze Momentum Indicator displayed an active squeeze release (white dots). While the prevailing trend according to the indicator was bullish, the appearance of the squeeze release coupled with dark green bars could mean that a trend reversal might take place.
The Relative Strength Index (RSI) for the alt was at 66.2, at press time, and highlighted the asset’s recovery from the overbought zone. However, buying pressure was still dominant. The asset had been oscillating between its $1.3 support and $1.95 resistance after testing the support mark on 11 June.
IOTA [MIOTA]
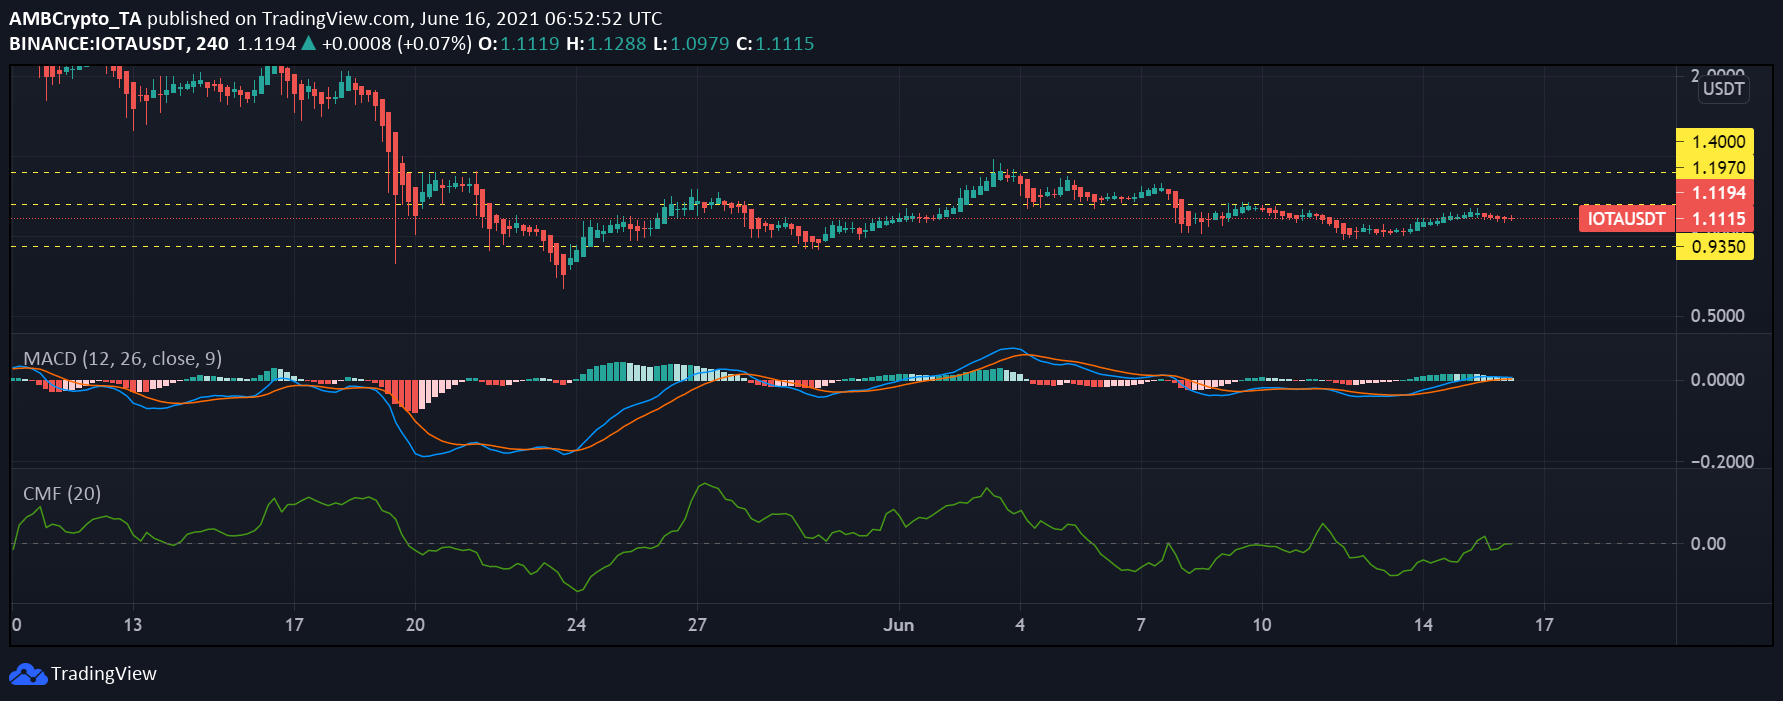
Source: IOTA/USD – TradingView
IOTA was trading at $1.1 at press time and was down 80.80% from its ATH. The alt noted a slower recovery as it oscillated between the $0.935 support and $1.197 resistance. Its price was down by 3.81% in one day and 2.24% over the last 7 days.
Capital inflows for the asset were seen increasing too as the Chaikin Money Flow noted a slight uptick. The CMF indicator touched the zero-line, keeping the asset in neutral territory.
Finally, the MACD line was moving in close proximity with the Signal line, meaning a bearish crossover could be in store for the asset.