
Binance Coin projected a minor pullback after trading within an up-channel that peaked at $644.7. Neo was gathering strength before attempting a move above a major resistance level at $102.15. Finally, Dogecoin broke north from a symmetrical triangle, but gains were cut short at the $0.37-resistance level.
Binance Coin [BNB]
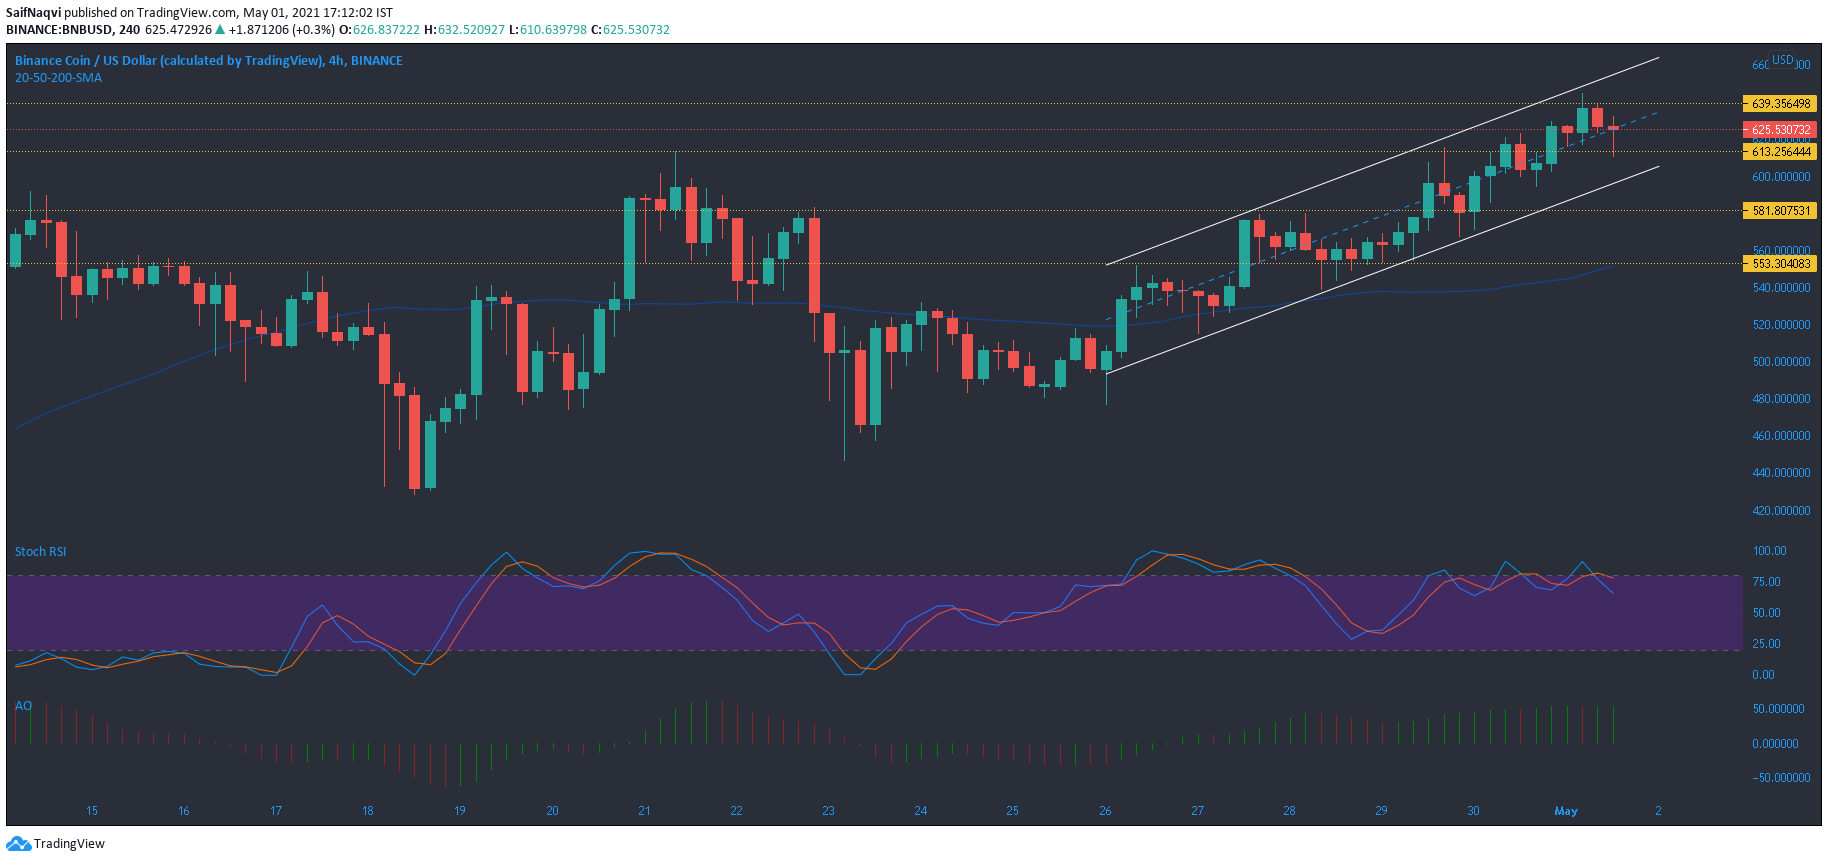
Source: BNB/USD, TradingView
Over the past few days, Binance Coin’s movement has been within an up-channel on the 4-hour timeframe. The price may have hit the peak of the current channel as there lay some resistance around the $640-mark. A breakdown from this pattern seemed possible over the coming sessions and a move below the equilibrium of the channel could act as a confirmation of the same. A southbound move could see BNB fall towards the $581-support or even towards $533.3 – a region that coincided with the 50-SMA (blue).
The Stochastic RSI formed its third peak in the overbought territory and dipped south, at the time of writing. On the other hand, momentum was on the bullish side, according to the Awesome Oscillator, and BNB could hit $650 before an eventual correction.
Neo [NEO]
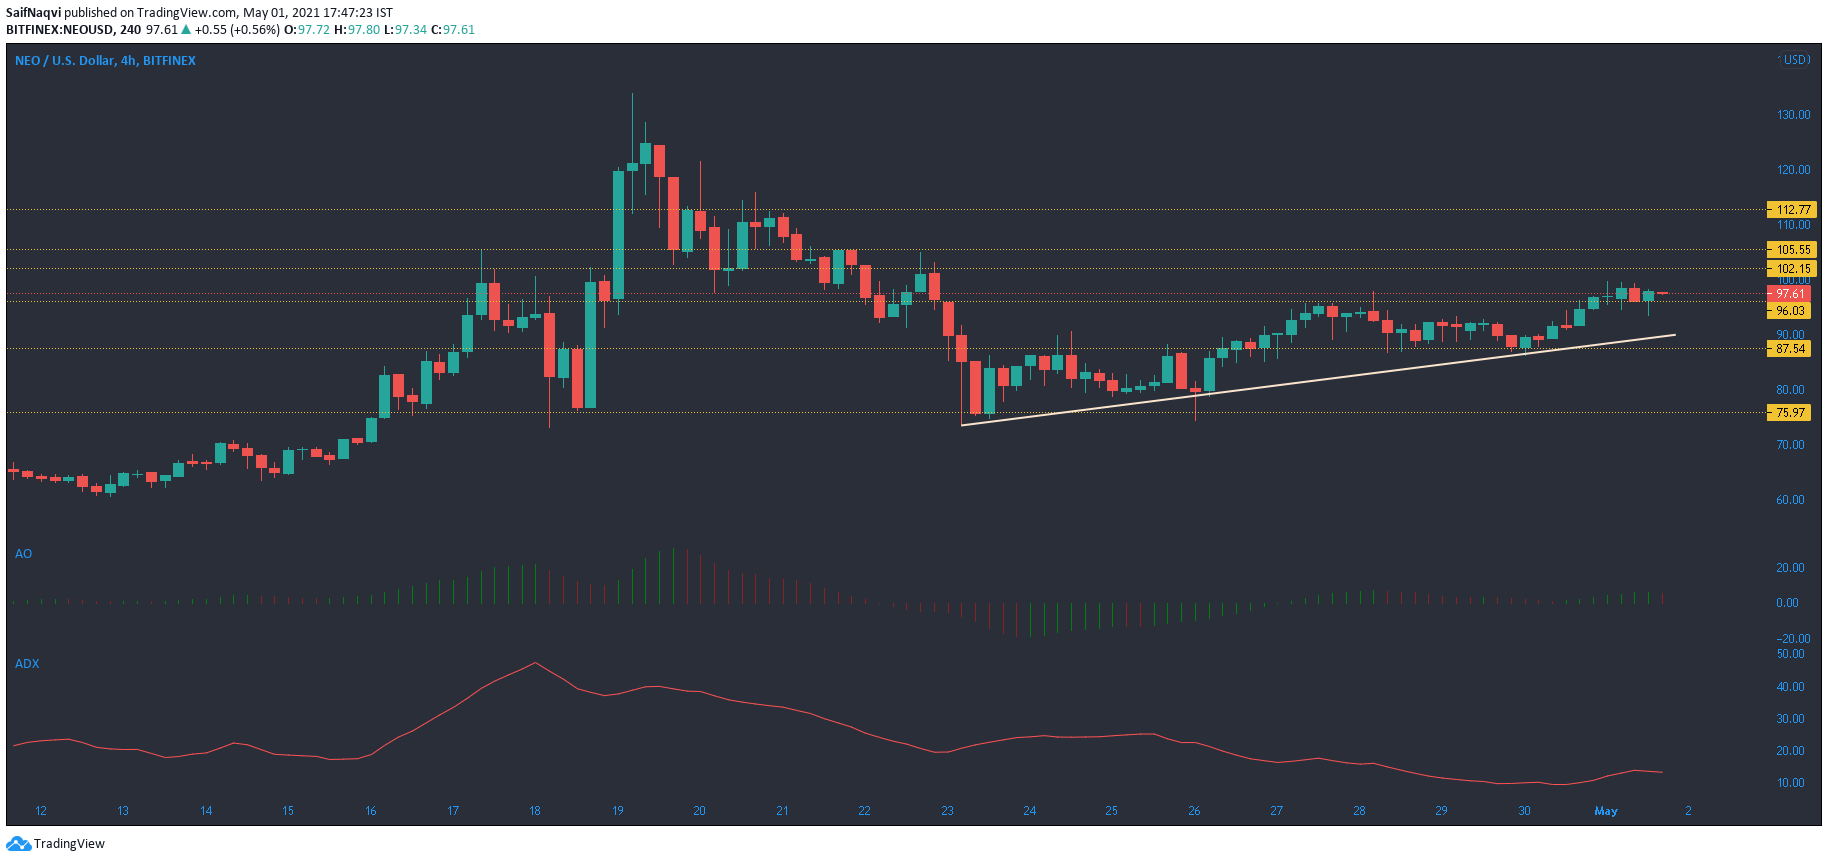
Source: NEO/USD, TradingView
Bullish movement over the last 24 hours helped Neo recapture the region above the $96-resistance, while support at $87.54 acted as a base for some buying. Even though the market reflected some bullish sentiment, a stronger test awaited the bulls at the $102.15-resistance. A successful recapture of this area would allow for sharper gains in the Neo market, but a hike towards the local top of $133.9 still seemed distant.
The Awesome Oscillator was slightly bullish as the price approached the $102.15-level, but the last session of trade did switch to red. The ADX Indicator clocked in at 13 and suggested that more strength was needed before a breakout above its immediate upper ceiling.
Dogecoin [DOGE]
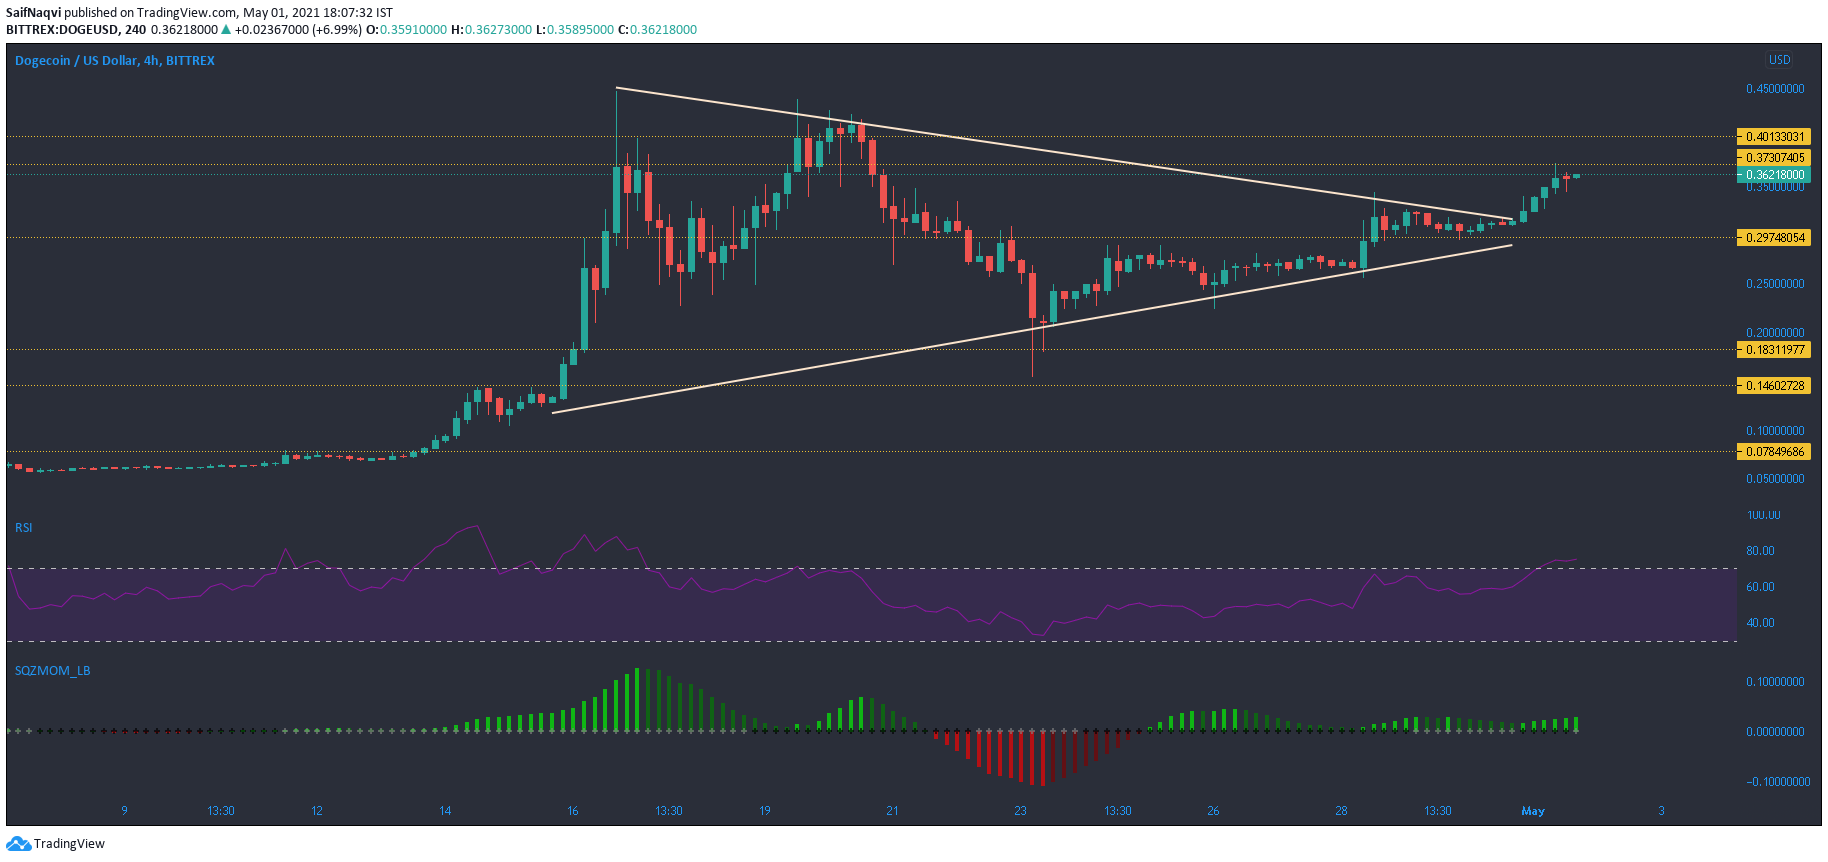
Source: DOGE/USD, TradingView
Having recovered from lows seen during the last week of April, Dogecoin formed higher lows on its northbound movement. On the 4-hour charts, Dogecoin saw a breakout from a symmetrical triangle and a move above the upper trendline represented gains of over 15%. However, there was some resistance at $0.37 and gains were restricted below this level for the time being.
The RSI forayed into overbought territory and a price correction looked likely over the coming sessions. However, the Squeeze Momentum Indicator still showed momentum on the bullish side and the price could rise above $0.40 post a minor pullback.