Binance Coin, Tron, UNI Price Analysis: 25 June

Major cryptos gained back some ground after facing some major losses on Tuesday. After dropping below $30,000 for the first time since January, Bitcoin was back to $34,213 at the time of writing, hiking by 3.1% over the past 24 hours. Major altcoins like Binance Coin, Tron, and UNI also profited off the back of this price gain for a while. Later, market volatility could be seen slowing down as the cryptos began to move sideways.
However, Binance Coin and Tron noted positive bullish momentum, even as UNI’s southbound movement met a halt.
Binance Coin [BNB]

Source: BNB/USD, TradingView
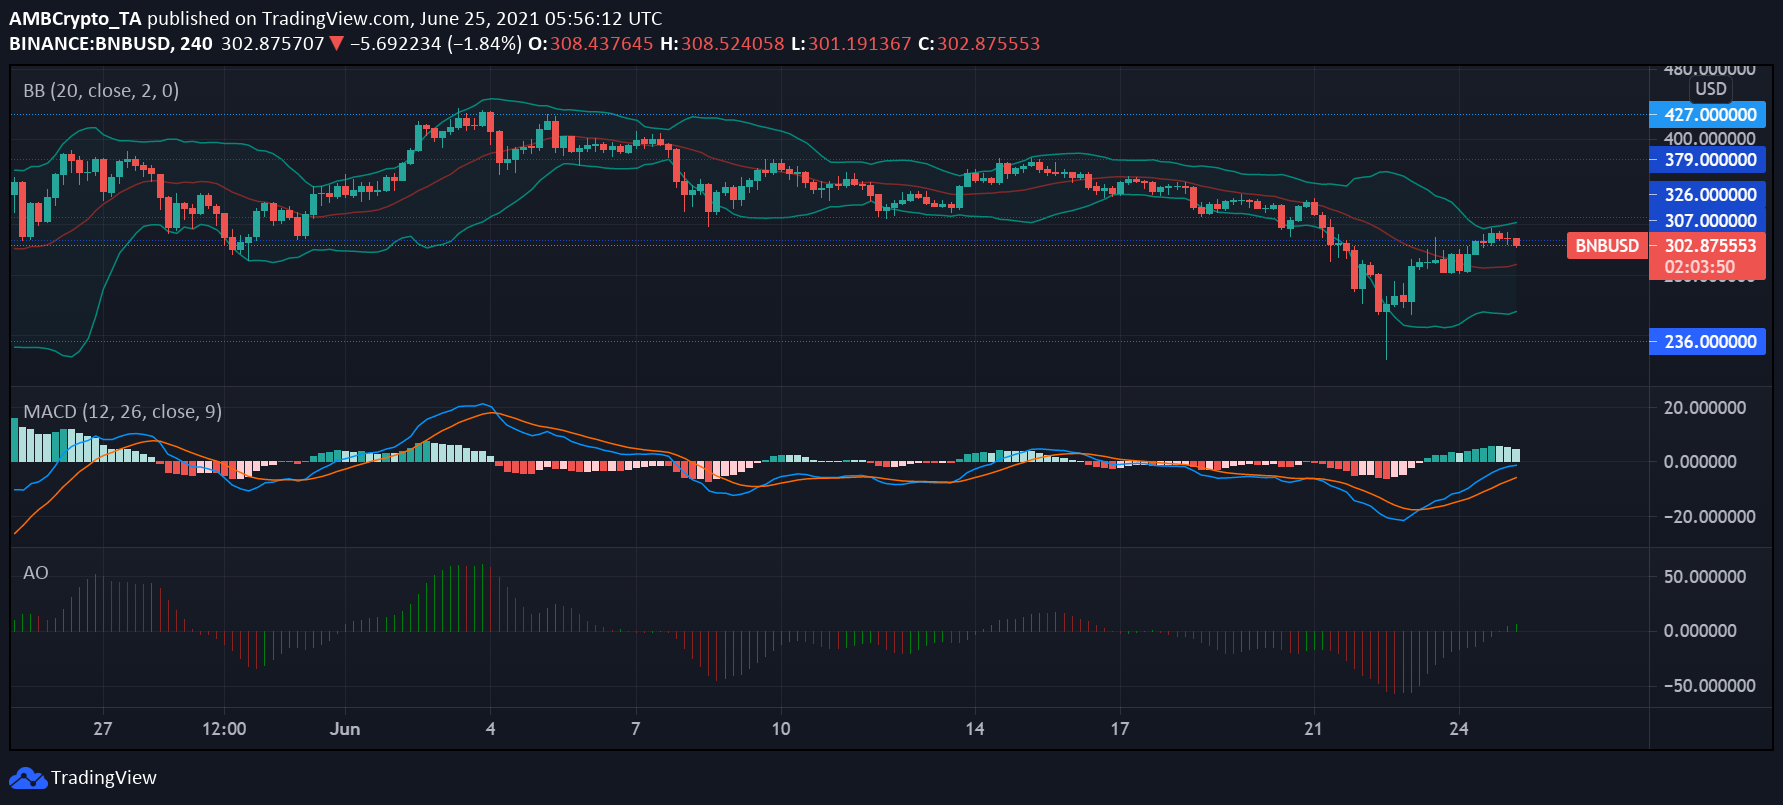
Ranked 4th on CoinMarketCap, Binance Coin was trading at $302 at the time of writing, with the alt hiking by 5% in the aforementioned period. In fact, it had gained by almost 38% since 22 June, the day when it hit a low of $224. After momentarily breaking through the $307-resistance yesterday on the 4-hour chart, the asset was again trading below it at press time.
The parallel movement of the Bollinger Bands suggested that high market volatility had come to a halt and stable price action could be expected in the near term.
Bullish momentum was cropping up on the Awesome Oscillator as the green bars moved above the histogram. The MACD and Signal lines pictured a bullish crossover on 23 June as the alt’s price recovered over the past few days.
BNB could go up to $326 before finding further resistance if the bullish trend continues.
Tron [TRX]

Source: TRX/USD, TradingView
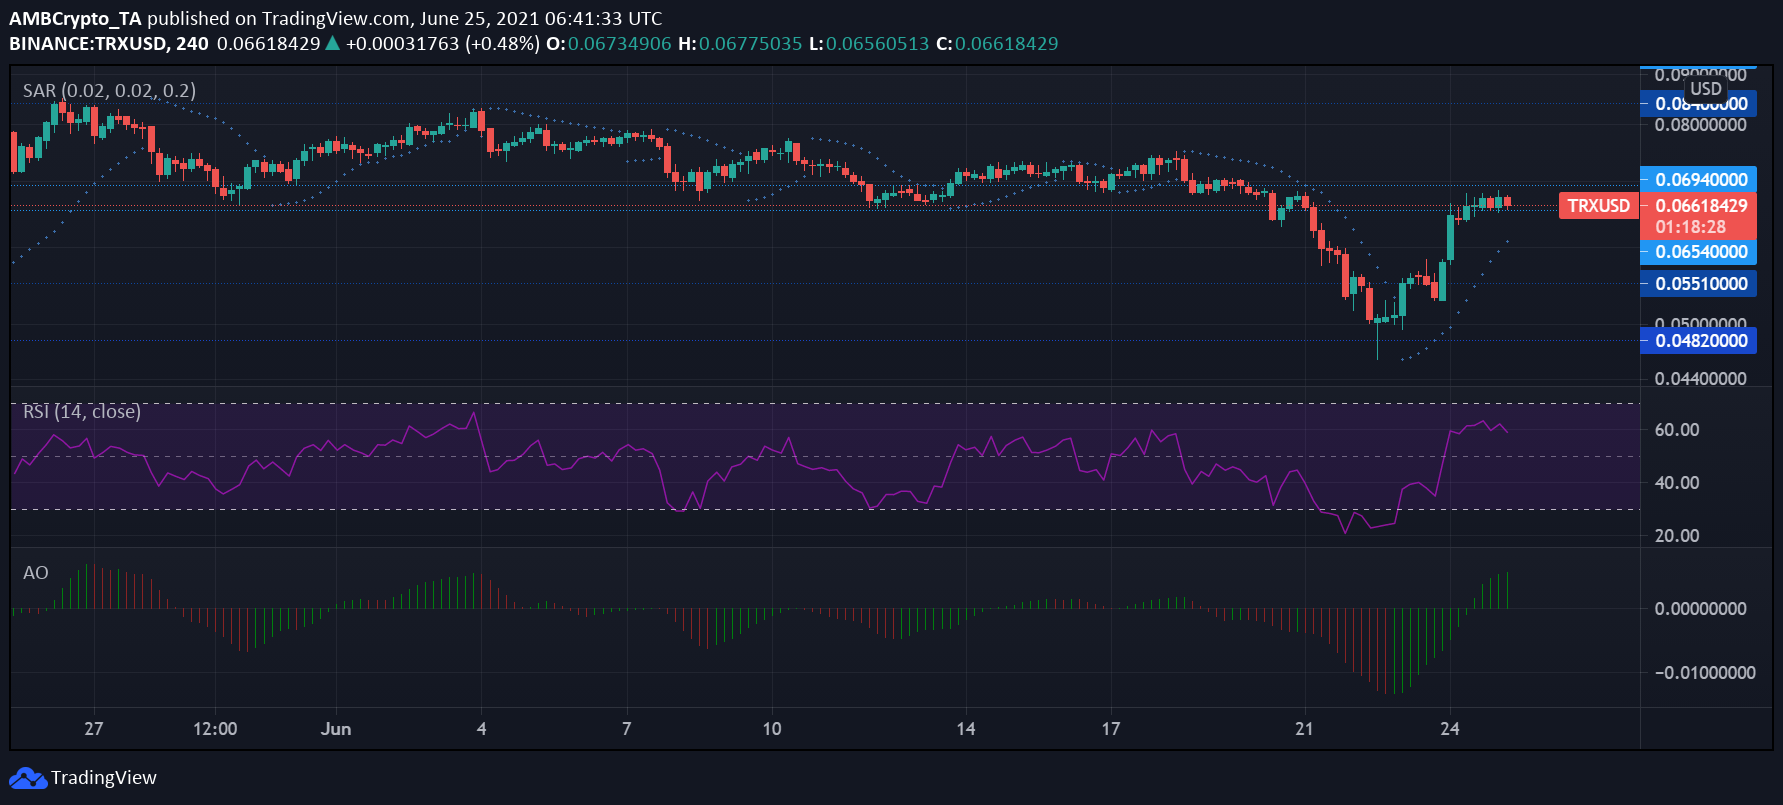
After touching a low of $0.046 on 22 June, Tron rallied up by 46% to trade at $0.066 at the time of writing. The crypto broke through the $0.065 resistance yesterday, which then began to act as a strong support level.
The Parabolic SAR’s dotted line hovered below the candlesticks as the coin’s price action continued to follow a bullish trend. Moreover, long green lines above the Awesome Oscillator’s histogram pictured dominant bullish momentum on the digital currency’s price chart.
A reversal from intense selling pressure could be noticed as the Relative Strength Index’s indicator exited the oversold region and held its position just below the overbought zone. While a minor downtick can be noticed, buying pressure continued to be greater than the selling pressure.
Even if the bullish price action holds out, the coin could face resistance at the $0.069-mark.
Uniswap [UNI]

Source: UNI/USD, TradingView
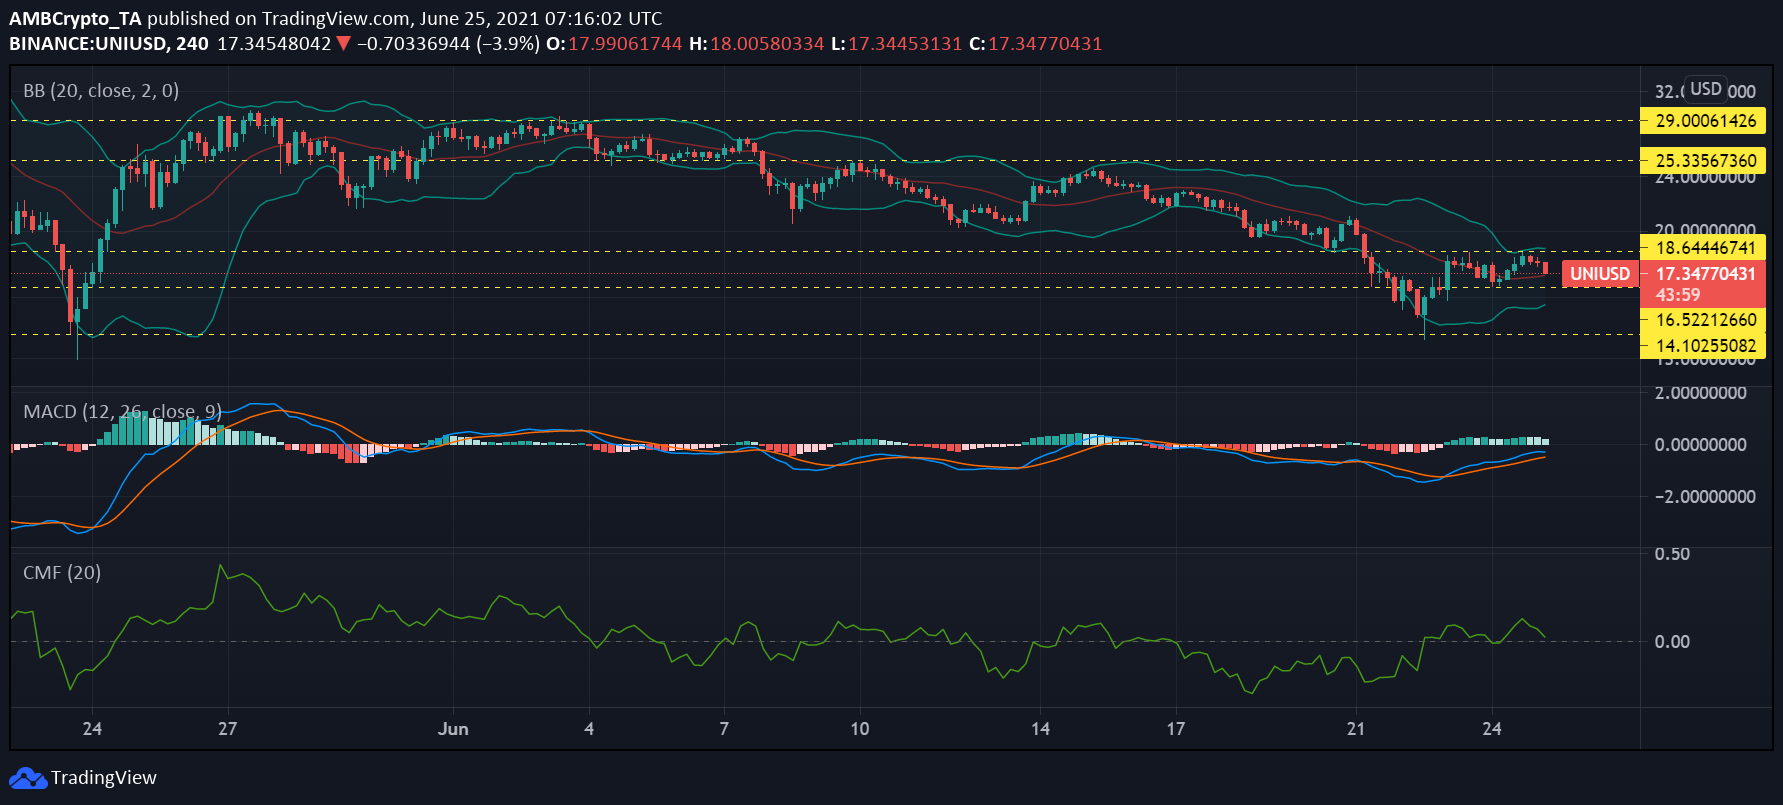
UNI has not been as lucky as the other alts as it was struggling to breach the $18.6 resistance, even as it found new support at $16.5. The asset did register a 2.18% price hike over the past 24 hours, however, and was trading in the red at $17.36, at the time of writing. The total value locked in the 7th highest-ranked DeFi token was $4.27 billion, according to DeFi Llama.
The coin’s market started turning less volatile, as indicated by the contraction of the Bollinger Bands. Restricted price action for the coin can be expected going forward.
While the buyers overtook the sellers for a brief period, the Chaikin Money Flow was again moving in a downward direction. It was at equilibrium, at press time, as capital outflows started to dominate the market.
A reversal of the bullish crossover from the MACD lines can be expected in the future, as suggested by the indicator’s histogram and convergence of the indicator lines.


