Binance Coin, VeChain, EOS Price Analysis: 26 December

As Bitcoin navigates through the recovery phase by forming an up-channel, it saw a pullout over the last day. Thus, the overall sentiment stayed near the ‘fear’ zone.
Altcoins like Binance Coin, VeChain and EOS resonated with this pullback while showing revival signs.
Binance Coin (BNB)
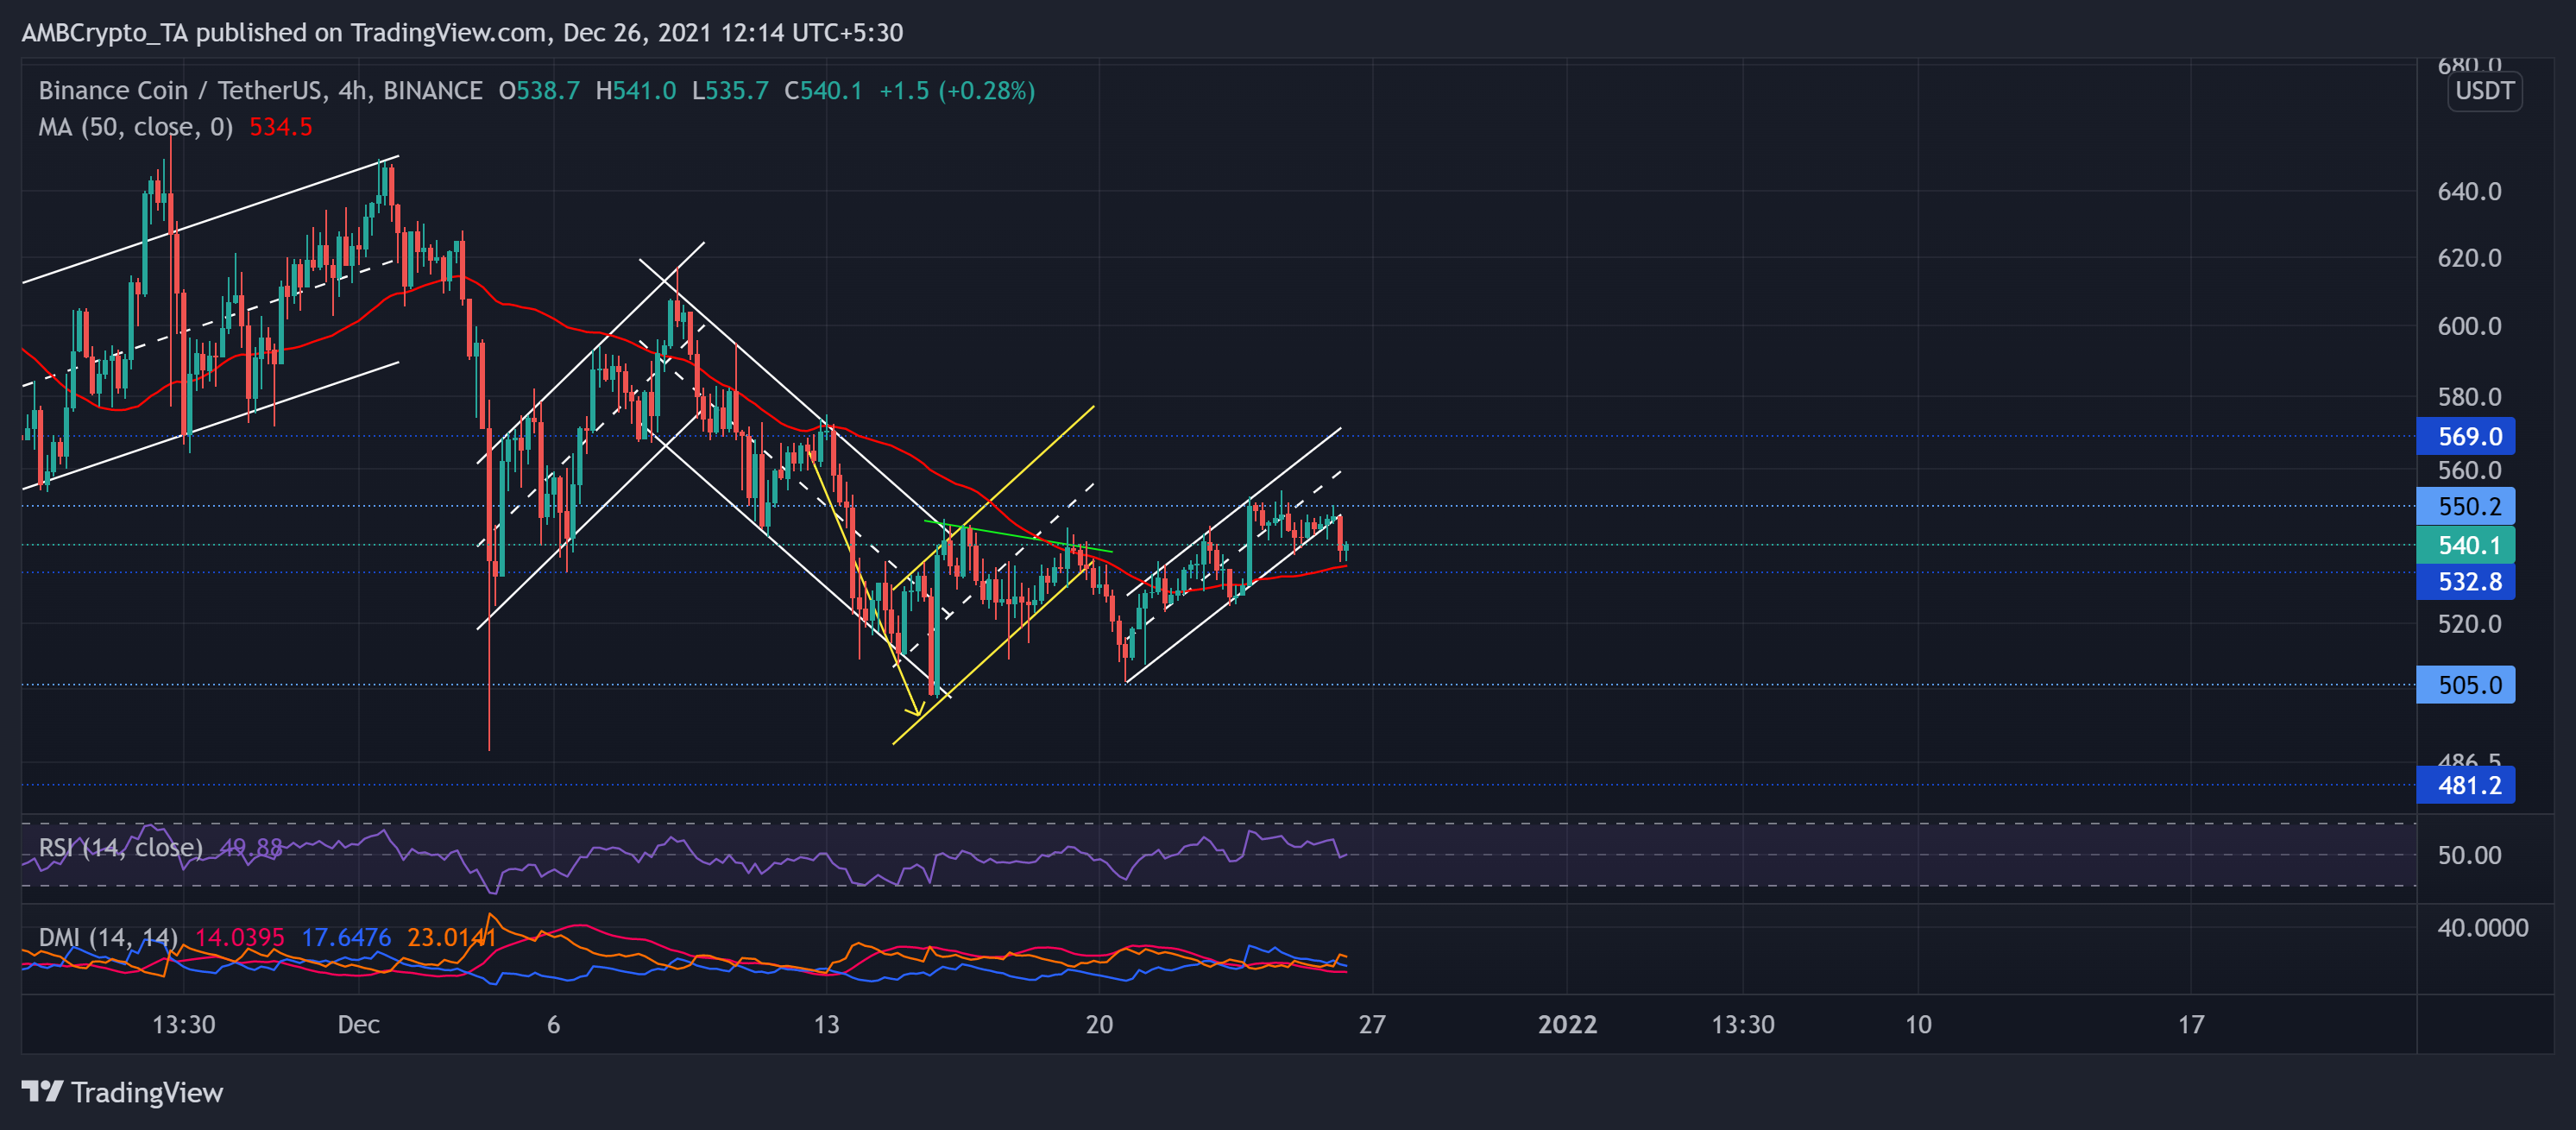
Ever since BNB poked its seven-month high on 7 November, the price action struggled to maintain its previous supports. While the alt halted its long-term uptrend, it upheld the crucial eight-week support at the $505-mark.
During the recent recovery phase, BNB formed an ascending channel (white) as the bulls breached a strong resistance point (previous) at the $532-level.
Presently, the price action saw resistance at the $550-mark as bulls endeavored to retest it. After Bitcoin’s 2.7% dip, BNB also declined by nearly 2.6% over the past few hours. The immediate testing level stood near the $532-level that concurred with the 50-SMA (red).
At press time, BNB traded at $540.1. The RSI stood at the 49-mark but showed revival signs from the half-line. The DMI resonated with the bears, but the ADX displayed a weak directional trend for the altcoin.
VeChain (VET)
While VET over retraced its previous bull run, the bulls ensured the five-month support at $0.076-mark. As a result, it saw a down-channel (yellow) breakout on 16 December.
Afterwhich, the price action marked a double-bottom since mid-December. After an expected patterned breakout, the alt grew by 23.82% since the 15 December low at press time. Thus, VET breached its long-term bearish trend resistance (white) while reclaiming the $0.087 lost support.
At press time, the alt traded at $0.09189. The RSI saw a pullback from the overbought region while the buying pressure decreased.
Although the MACD lines were above the equilibrium, its histogram went below the zero line, depicting decreasing bullish momentum. To top that up, the Volume Oscillator marked lower highs and reaffirmed the previous weakness.
EOS
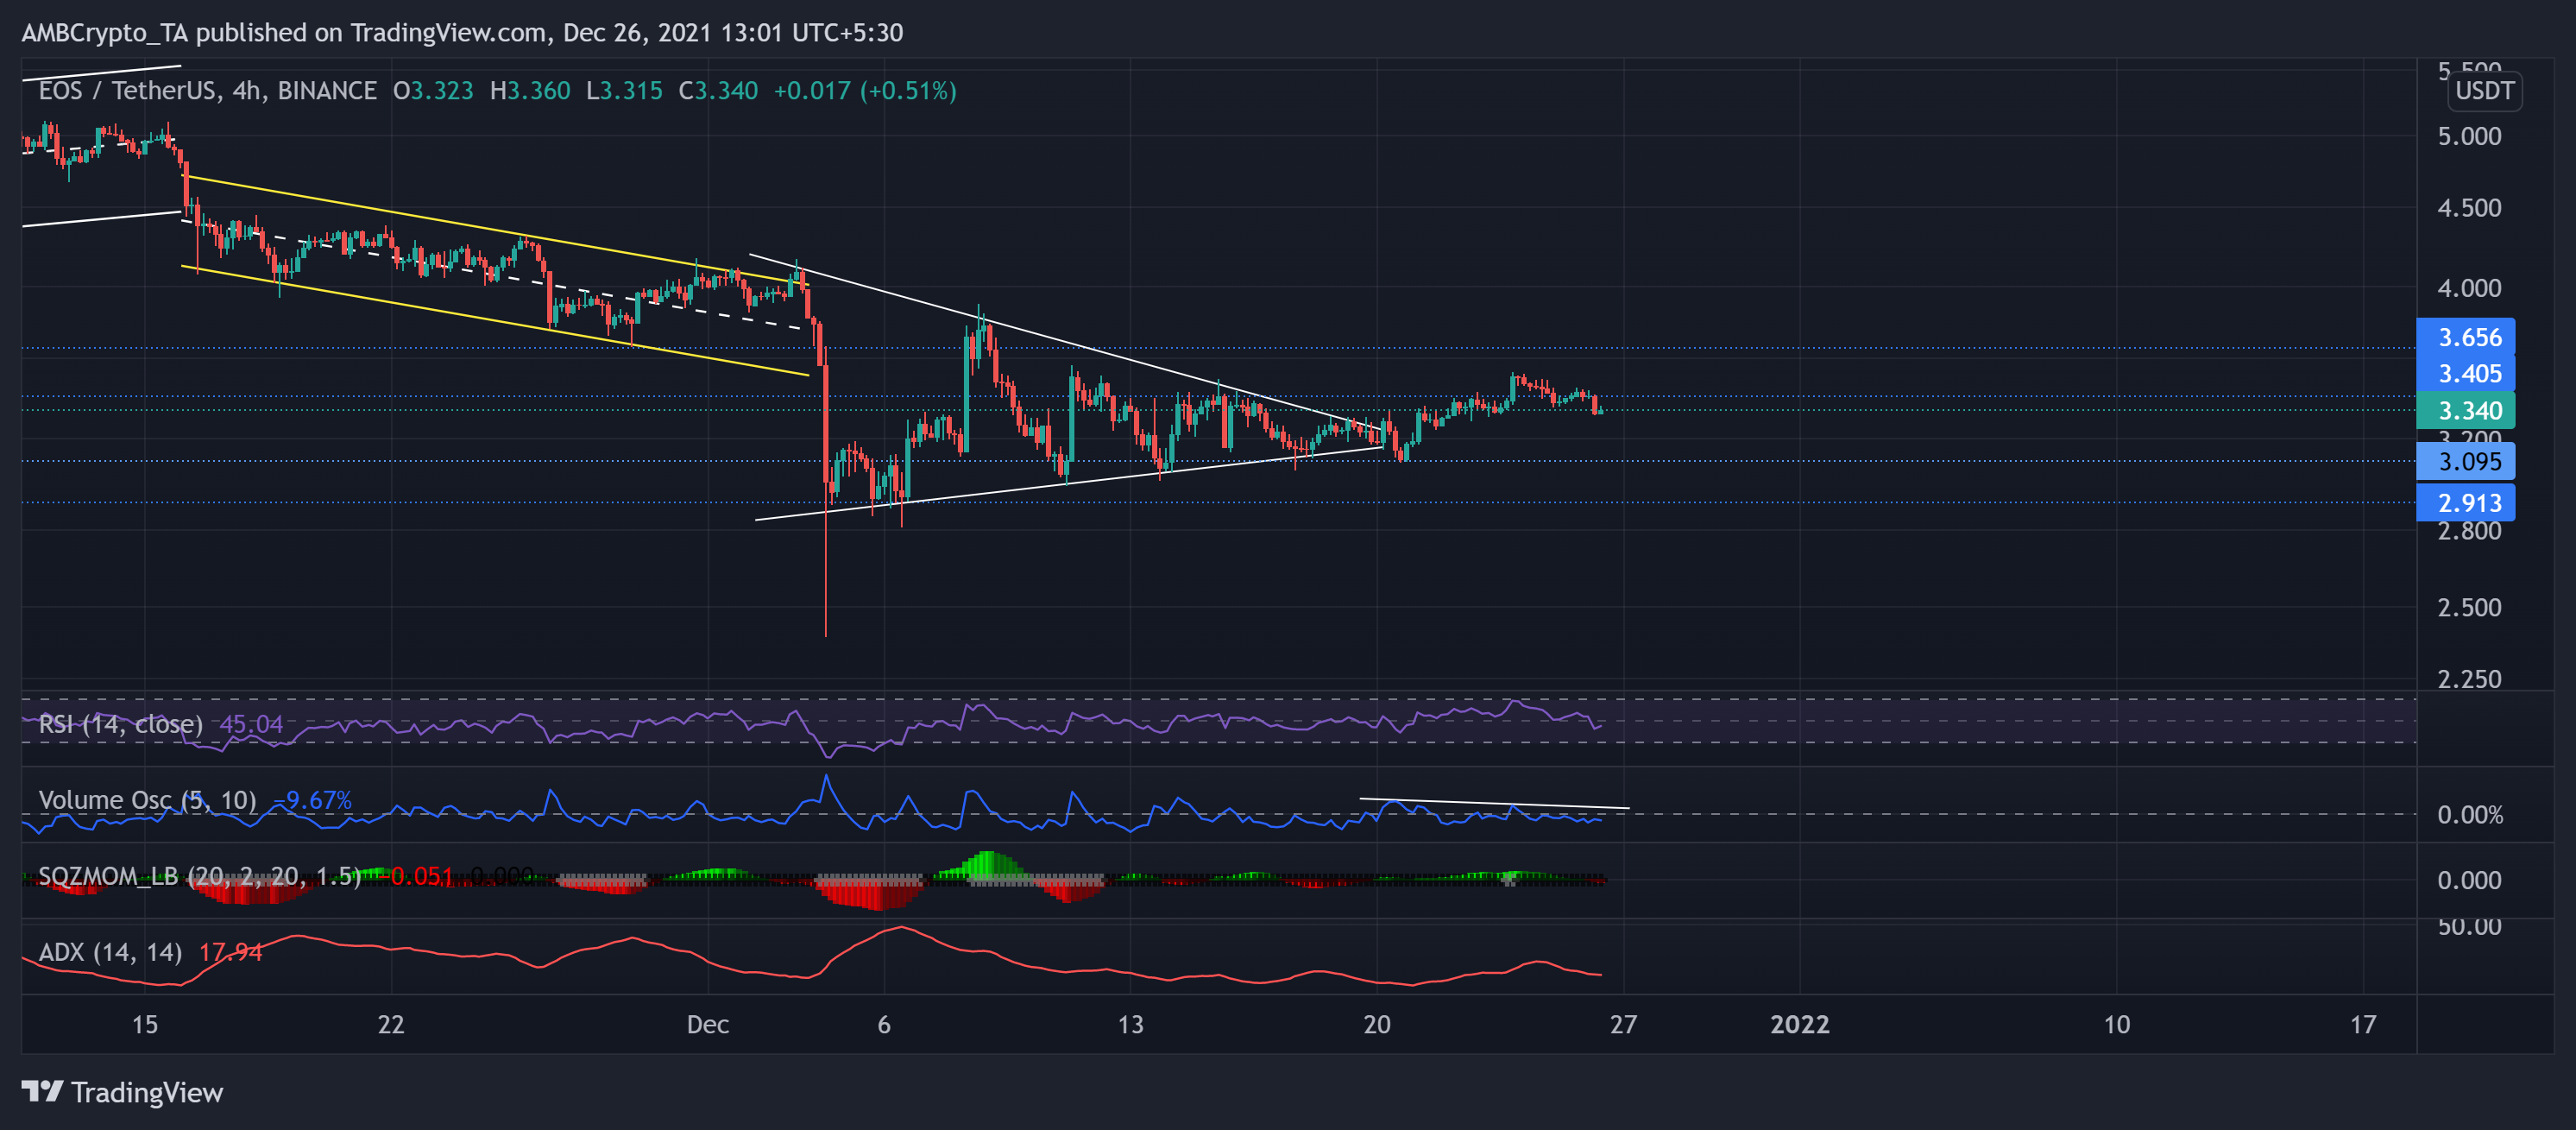
EOS saw a symmetrical triangle breakout over the last six days. The bears retested the $3.09-level multiple times, but the bulls held their ground. They propelled an over 12% rally (from 20 December low) and breached the $3.4-mark.
But following a broader pullout, the alt yet again found an oscillating range between $3.4 and $3.09 over the last 14 days. As a result, The Squeeze momentum indicator resonated with the consolidation tendencies and flashed black dots.
At press time, EOS was trading at $3.34. The RSI was below the half-line after showing some revival signs. The ADX continued to display a weak directional trend for the alt. Like VET, the volume oscillator marked new lows during this upturn rather than a hike, visibly indicating a weak bullish motion.


