Bitcoin and the increasing importance of on-chain data, analytics

On-chain analysis has become quite integral to Bitcoin analysis over the past few years. Understanding supply-demand dynamics, levels of activity, and short-term long-term holder mechanics define some trading characteristics of the network.
Yet, during an aggressive bullish market, the credit is laid out more towards investor sentiment or futures market, which is considered as breakout catalysts. While not completely away from being accurate, it is important that the on-chain fundamentals are looked upon from a point of economic flow and market participants since they predominantly describe the larger market horizon.
Are these metrics describing the larger importance of Bitcoin on-chain?
While metrics such as MVRV ratio, SOPR have been discussed extensively over the past few months, some of the following metrics describe asset valuation from a long-term narrative which allows asset managers to gauge better valuation for Bitcoin.
Yassine Elmandjra, Analyst for ARKInvest, recently discussed the importance of valuing Bitcoin and one of the key metrics determined by Investor capitalization.
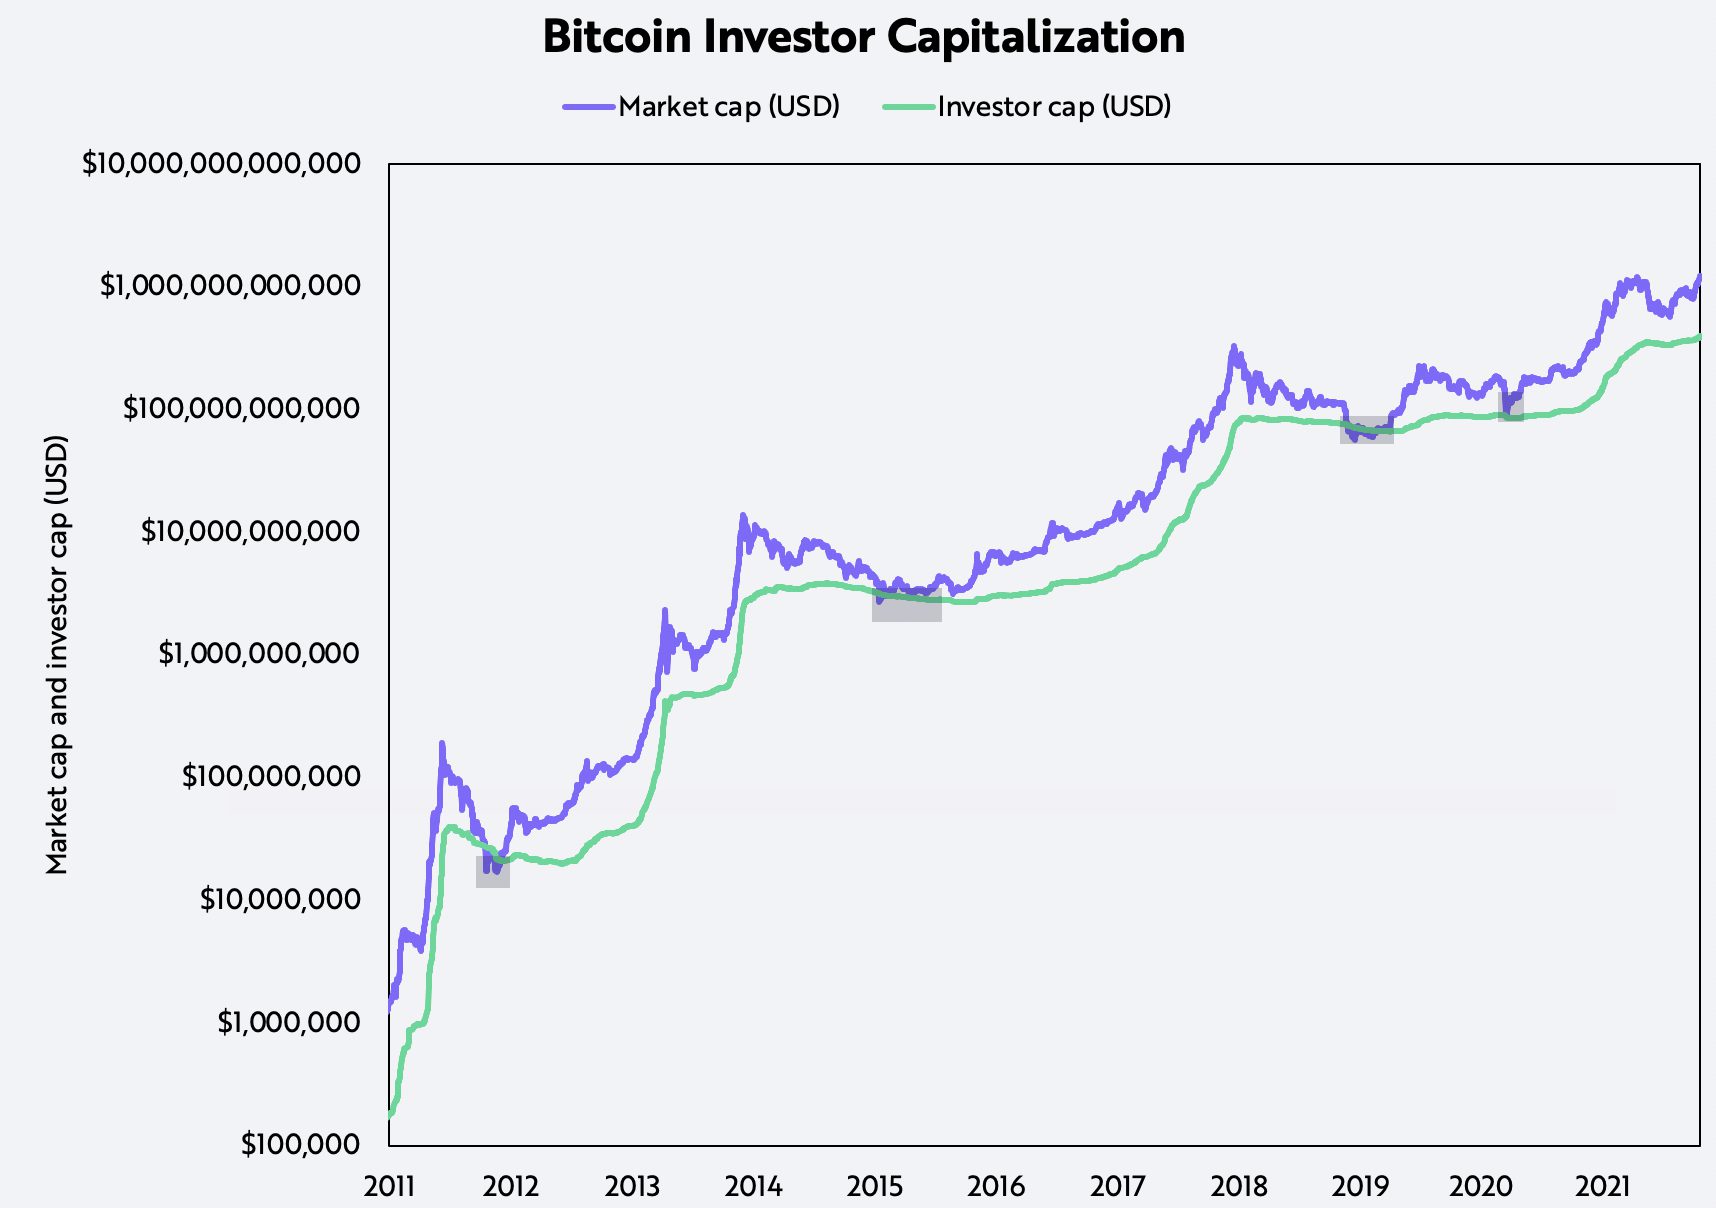
Now, Investor capitalization is realized valued minus the Thermo cap. In layman’s terms, the outstanding value paid to miners is removed from the overall cost basis, and the actual cost of Bitcoin can be identified at the bottom of a market cycle.
While, Short-to-Long-Term-Realized-Value (SLRV) can be used to identify the start of a bull market, as it compares the short-term velocity relative to medium/long term velocity. While the SLRV usually oscillates between 0.1 to 1, any value above 0.4 indicates the possibility of a bullish cycle.
Another key metric that involves understanding volatility and selling pressure/losses during a price dump is Seller Exhaustion Constant.
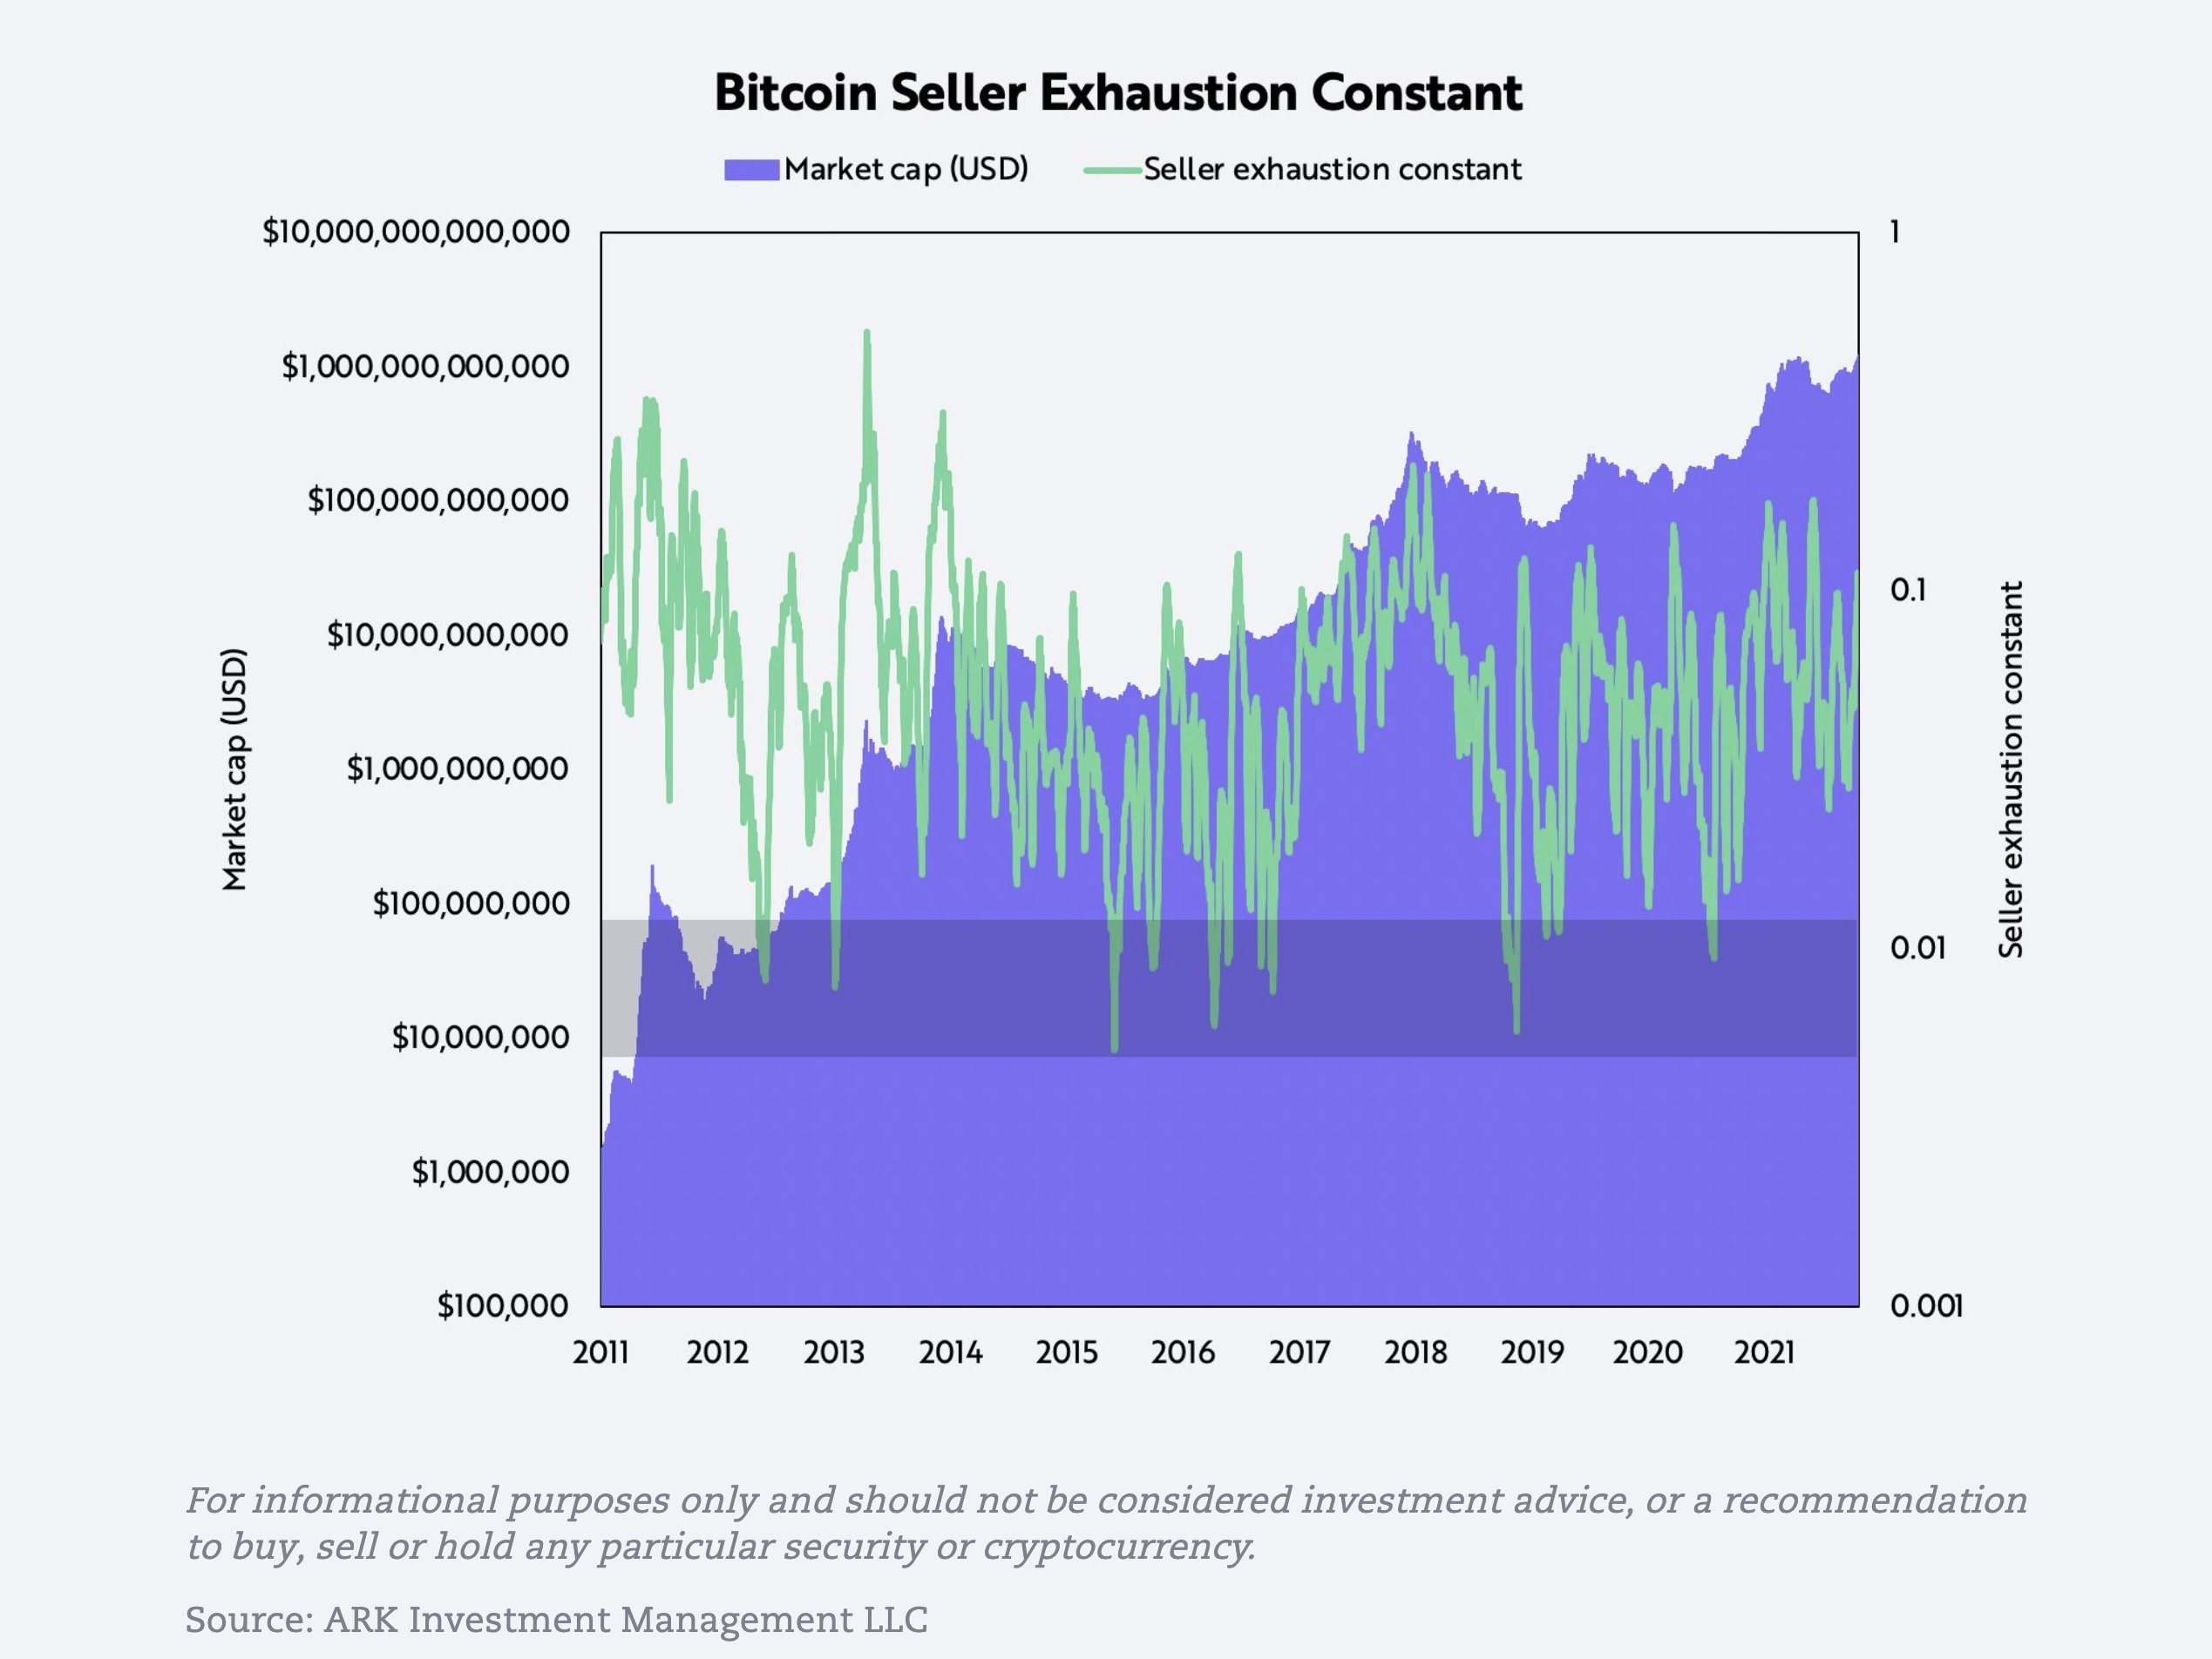
According to the report,
“The seller exhaustion constant is the % of bitcoin total circulating supply in profit multiplied by its volatility over the last 30 days. The combination of low volatility and high losses is associated with a bottoming out of the bitcoin price.”
Now, these metrics may sound relatively new and complex to gauge on the first read, the downright fact is that these metrics identified several bottoms and top signals over the past 18-months.
If the Seller Exhaustion Constant chart is observed, it identified the bottom in January 2019, and also touched upon the bottom during March 2020 collapse. At press time, the indicator is fairly neutral hence it can be taken as a guaranteed outlook that BTC will eventually drop a little more than its current valuation, irrespective of bullish conditions.
On-chain is only getting better with time
With respect to the traditional asset class, the digital asset industry is extremely different because its financials cannot be gauged by company returns or quarterly financials.
Since it is based on a blockchain ledger, the on-chain analysis will only get better with time, and asset managers, long-term investors would need to rely more upon data, than sentiment to be consistently profitable in the Bitcoin market.