Bitcoin and why it’s not a good idea to ‘get fooled’ by this notion

Decreasing market cap doesn’t always show the real picture…
Bitcoin and the entire cryptocurrency market stand on shaky ground right now. Bitcoin, at press time, was trading under the $42,000-mark following a fresh 2% price correction. Also, the Bitcoin Fear & Greed Index showcased a “fear” sentiment across its platform. Now, this might indicate growing bearish projections across the board, but a few technical indicators say otherwise.
‘Don’t get fooled’
The king coin might just be flashing some vital signs, some that might just highlight a completely different picture. Popular crypto-analyst Nicholas Merten, for instance, in a recent YouTube video, hinted at some bullish indicators to offset the increasing uncertainty.
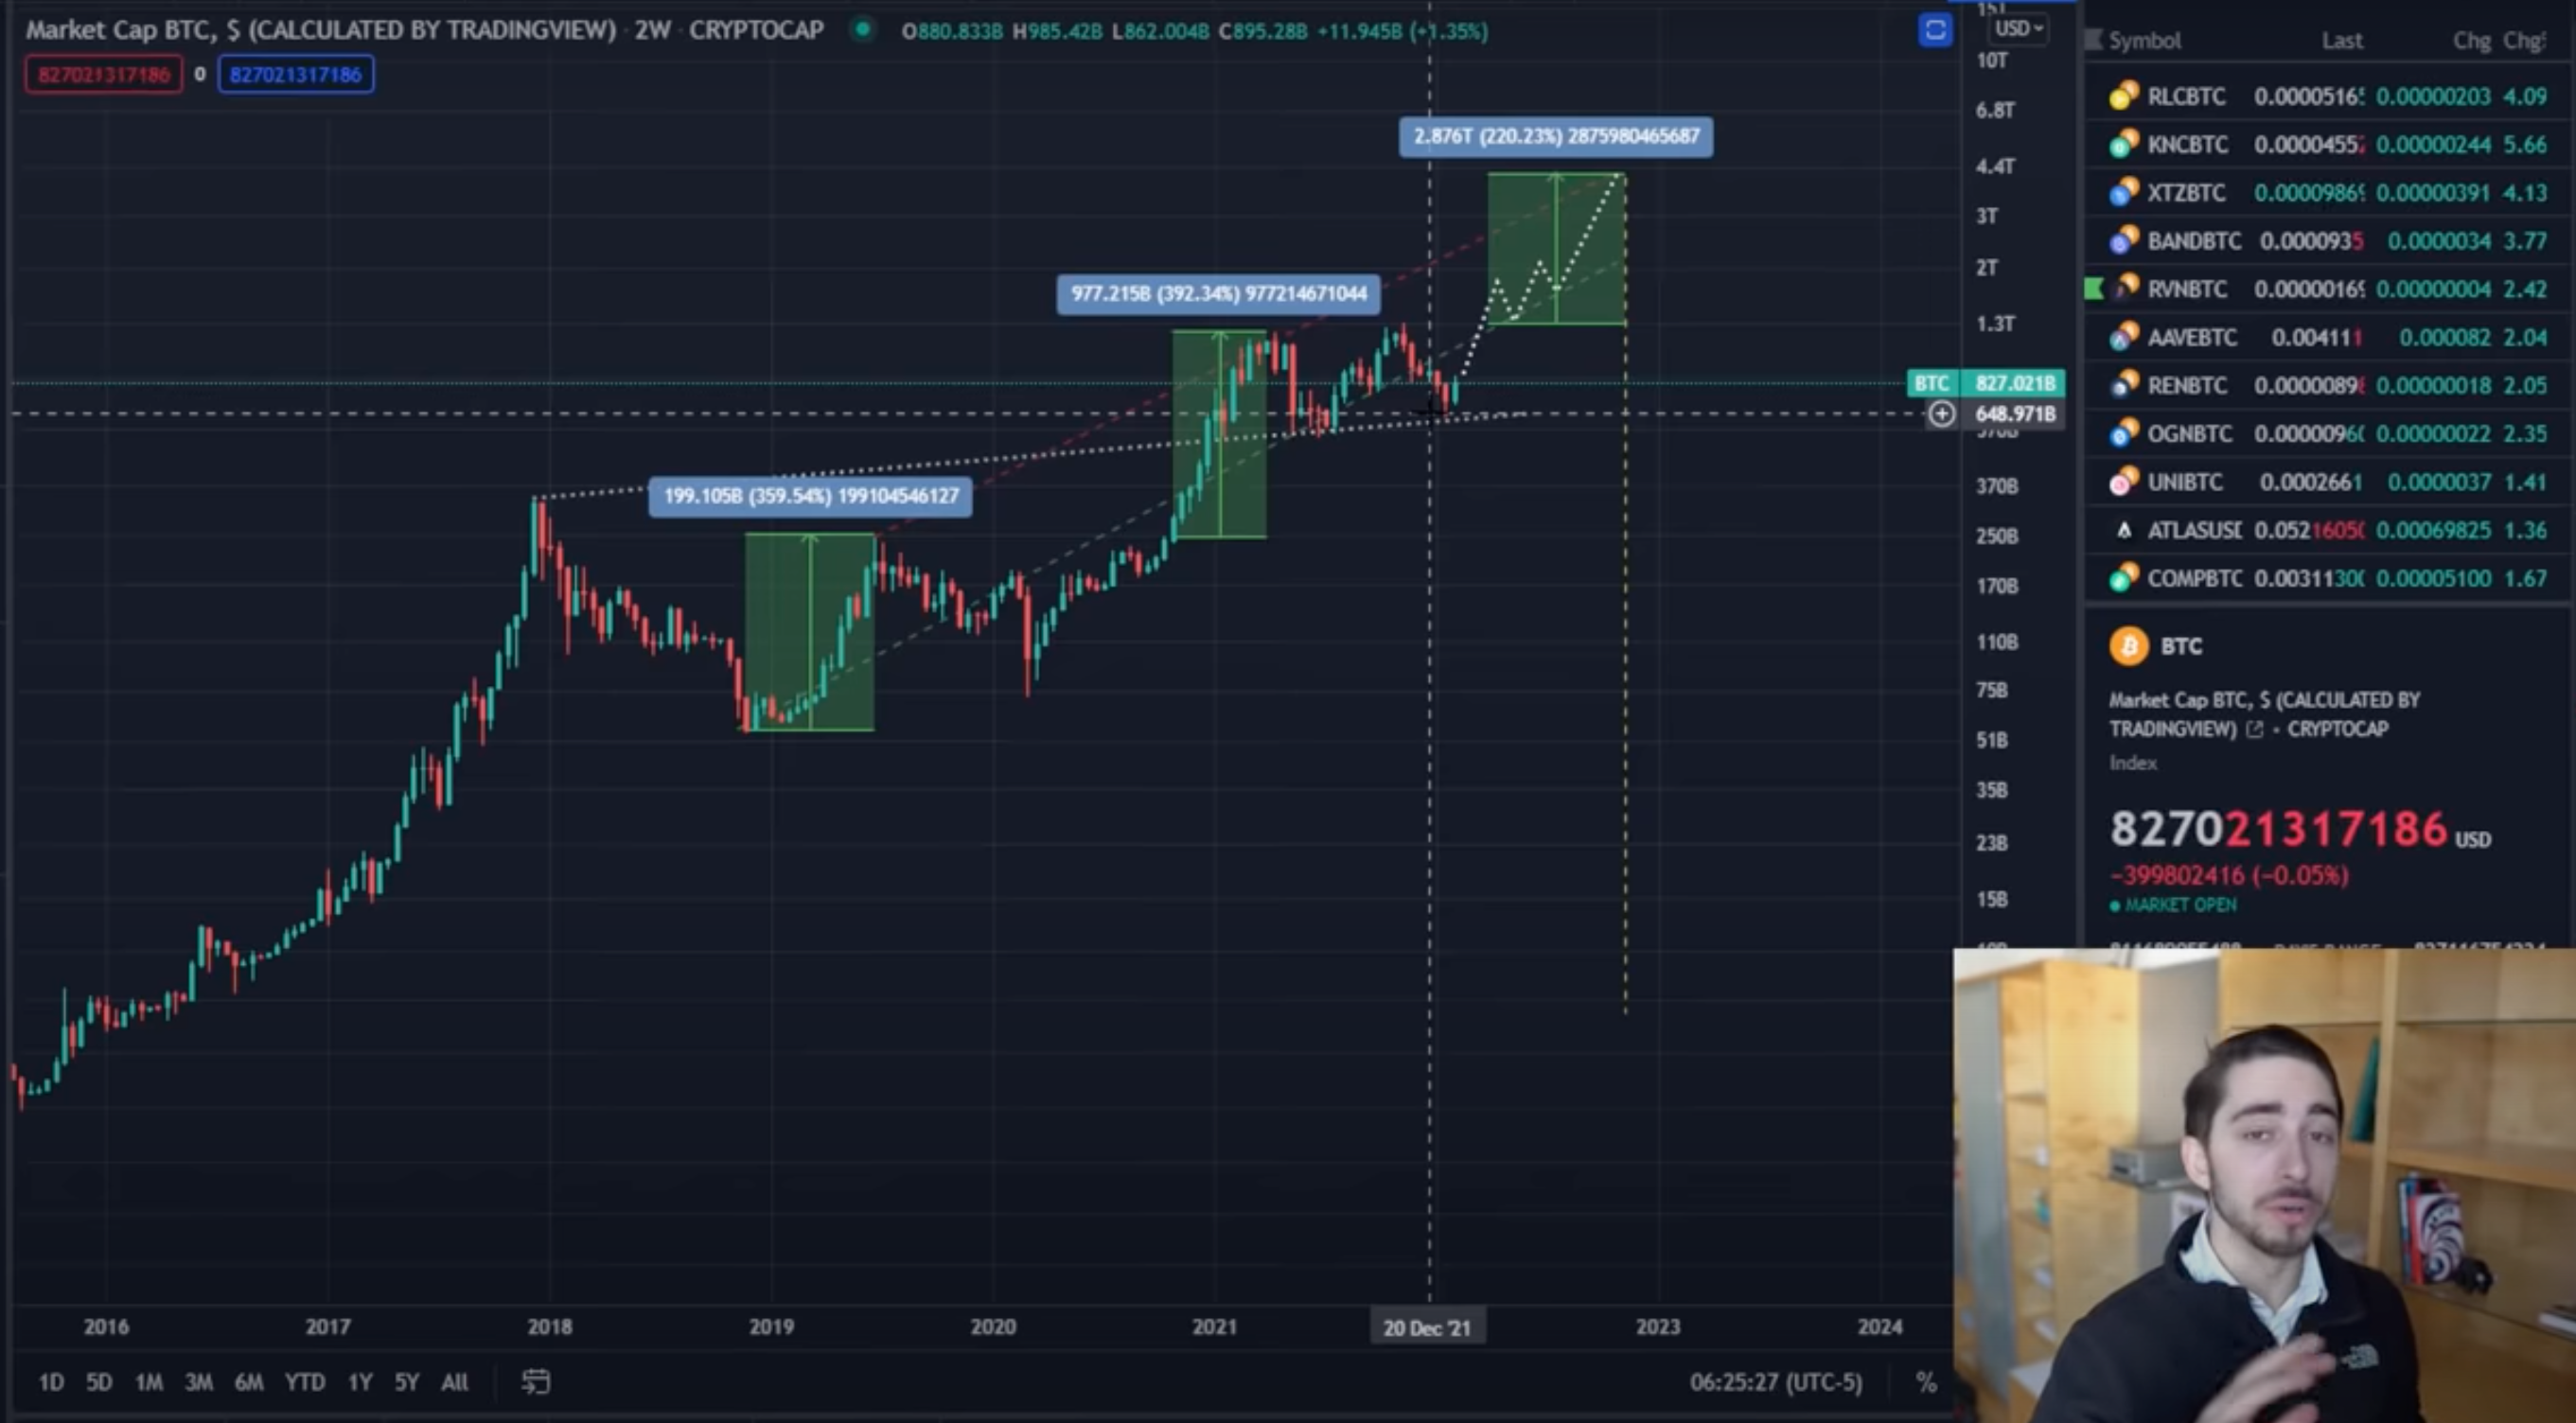
According to the analyst, the aforementioned graph highlights a “really interesting technical pattern”.
“This is a signal that the bulls are in the lead. Don’t let the sideways consolidation we’ve been in get you fooled that this is somehow a bear market.”
Bitcoin, despite the correction, isn’t in a bear cycle as in crypto, historically, a bear market means an over 50% correction. Likely, somewhere in the 70%, 80%, 90% range. “That’s what a bear market is for an exponential asset like crypto,” Merten said.
“Buyers are coming in and making previous resistance ascending support, and that is a really good telltale sign we’re not making really lower highs. The highs are relatively consistent. The lows are getting higher. The buyers are paying a premium here, and it’s showcasing that the market might be ready to turn back into forming the next uptrend.”
Despite the volatility, BTC had a similar ride dating back to December 2017. Bitcoin may have seen a volatile 2021 and a shaky start to 2022, similar to 2017. But, taking into account the previous highs (& lows) back in December 2017, “each of these lows, they line up each and every time”
In fact, the trader believes that Bitcoin could hit an overall market cap of $4 trillion, with each coin trading around the $220k-mark by the end of this year. This would mean a 385% hike from its press time price level.
Merten’s assertions are also in line with those of a Quantum Economics’ Analyst, with the latter recently claiming,
“… the price drawdowns after both #Bitcoin ATHs this cycle have been small and brief compared to previous bear markets.”
The indicators say Bitcoin is…
Now, although, it might be difficult to predict future price actions, some indicators do suggest bullish confidence over a shorter timeframe.
The Number of Exchange deposits, for instance, according to Glassnode, fell to a 19-month low of 2,016.696. At the same time, the amount of supply painted a similar picture as well.
📈 #Bitcoin $BTC Amount of Supply Last Active 3m-6m (1d MA) just reached a 1-month high of 1,332,547.613 BTC
Previous 1-month high of 1,332,078.519 BTC was observed on 12 February 2022
View metric:https://t.co/xD7zWV6u5s pic.twitter.com/onRzgB3YIS
— glassnode alerts (@glassnodealerts) February 14, 2022
Then, there’s the matter of Saturday seeing a notable increase in active addresses – “a nice sign of increased utility, a predecessor to price rises.”
📊 #Bitcoin had a mild decline over the weekend, but Saturday was the highest amount of active addresses (1.08M) recorded in 2022. The uptick in participants transacting on the $BTC network is a nice sign of increased utility, a predecessor to price rises. https://t.co/37X2TtYk5S pic.twitter.com/ZP0vrgm5KB
— Santiment (@santimentfeed) February 14, 2022
Overall, will these projections aid the king coin in finally breaching the resistance level? Let’s wait and watch. For now, the best course of action, ergo, is to look out and DYOR.


