Bitcoin Cash [BCH]: Could March 2020 levels be invalidated in weeks to come

Disclaimer: The findings of the following analysis are the sole opinions of the writer and should not be considered investment advice
Bitcoin Cash has a +0.99 price correlation with Bitcoin, which meant that the movement of Bitcoin Cash on the charts pretty much follows the movement of Bitcoin. This could be bad news for Bitcoin Cash holders, as Bitcoin faces stiff resistance overhead. A move back above $220 would be needed to suggest a shift in bias towards the bulls for BCH, but this might not materialize for a while.
BCH- 1 Day Chart
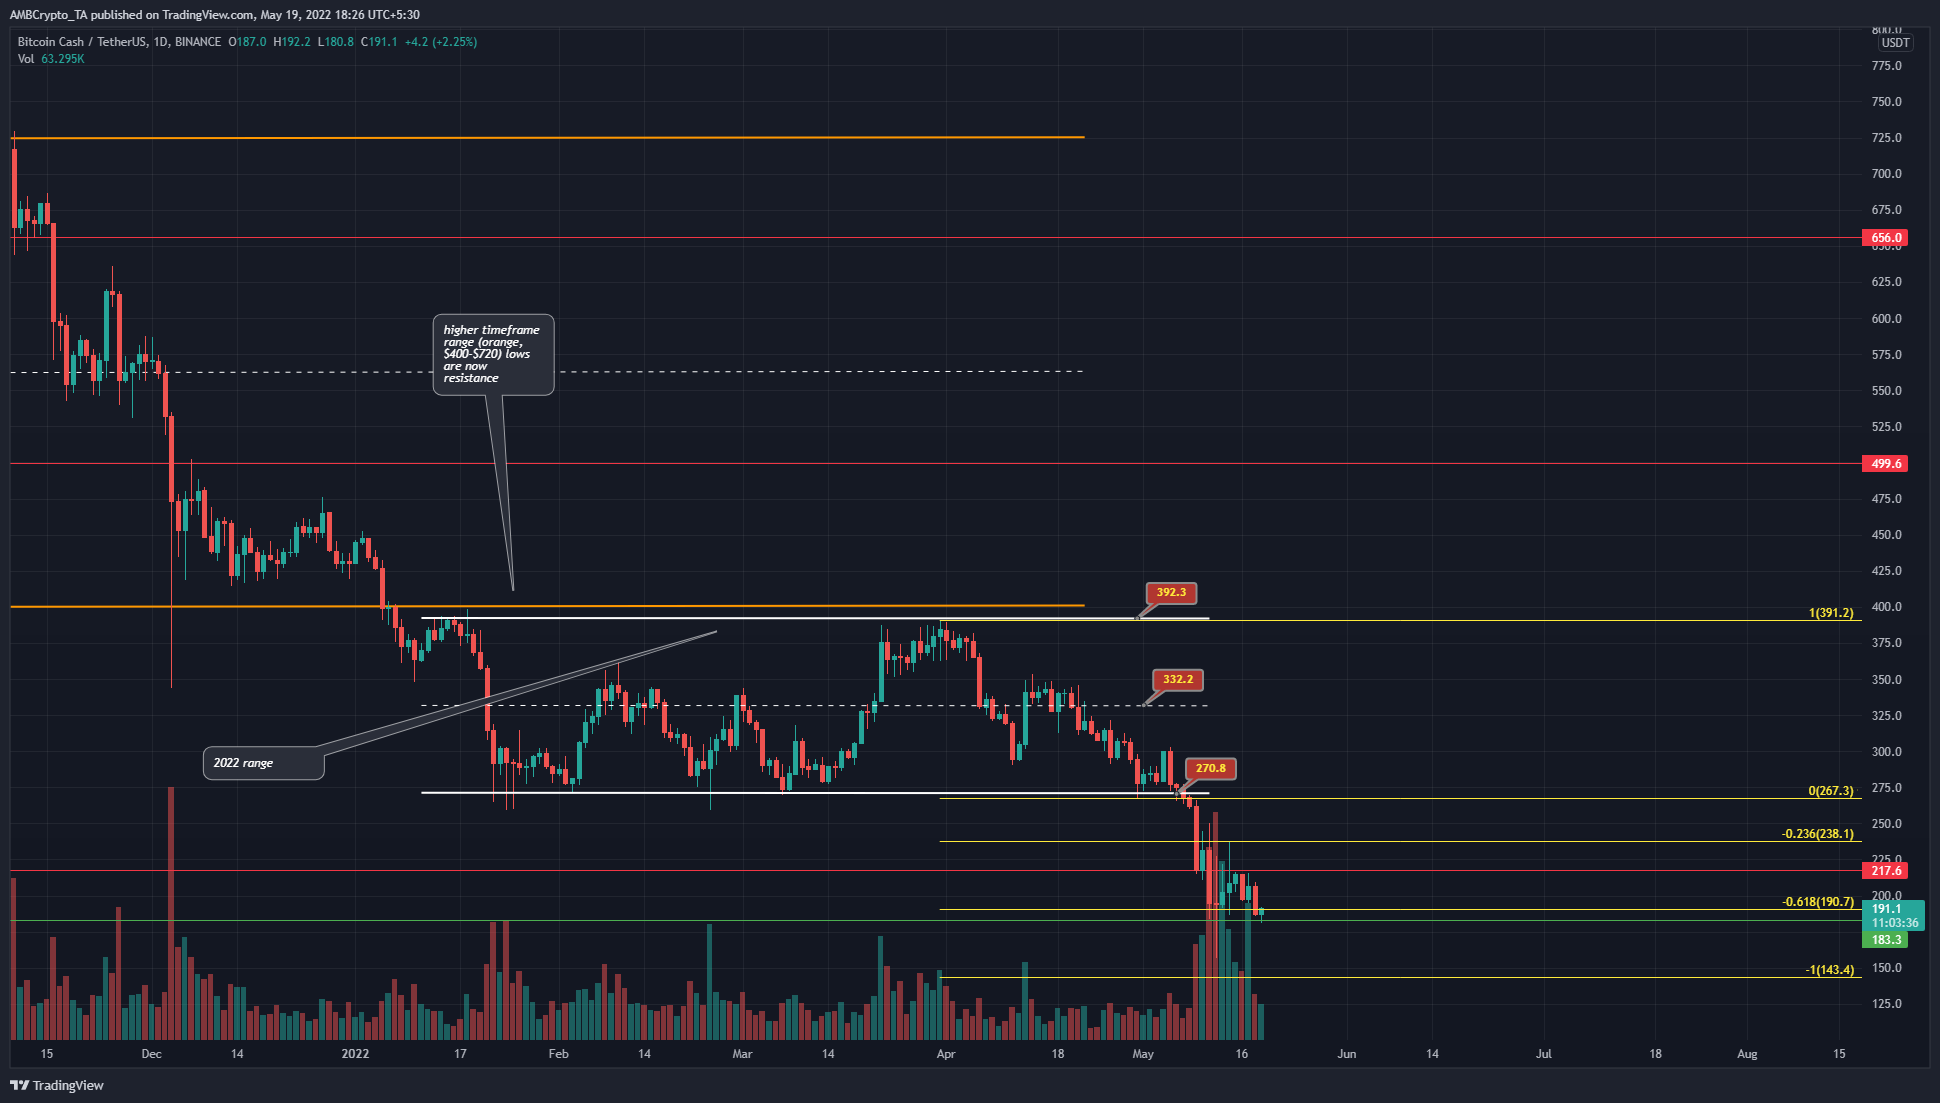
From June 2021 to December 2021, Bitcoin Cash ranged from $732 to $400. Since November 2021, Bitcoin Cash has been in a steady downtrend and slipped beneath the longer-term range lows at $400. In doing so, it established yet another range from $390 to $270, and in the past few weeks, the price slipped beneath the more recent range’s lows as well.
A set of Fibonacci extension levels (yellow) were plotted based on BCH’s drop from $391.2 to $267.3, and the 61.8% and 100% extension levels of this drop lie at $190.7 and $143.4. Just beneath the $190.7 level is a horizontal level of support at $183.3, which provided some confluence of support for the price in the past few days.
However, the intense selling appeared likely to push BCH further down the charts, and $143 could be a take-profit target for short positions.
Rationale
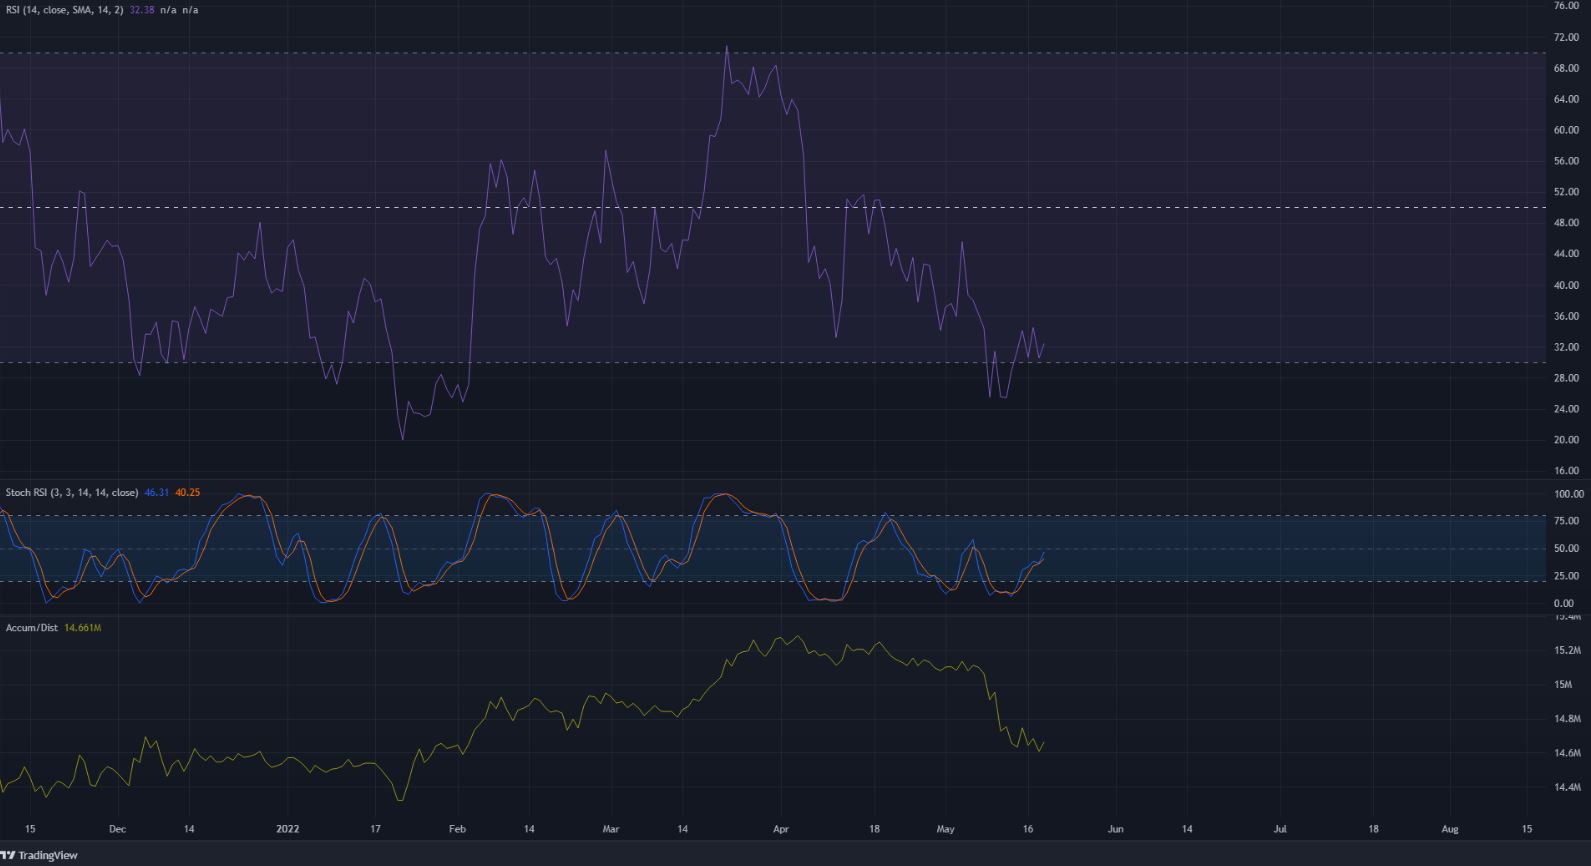
The RSI has been below the neutral 50 line since April 2022, and at press time stood at 32. Usually, a move back above 40 on the RSI can be said to indicate weakening bearish momentum, but that has not yet transpired for Bitcoin Cash. The Stochastic RSI was climbing, but this need not be a signal of a momentum reversal. Rather, a bearish crossover on the Stochastic RSI can be seen as a sign of strong bearishness.
The A/D indicator posted gains in the months of February and March when BCH was trading within a range from $270 to $390. At the time, it was thought that this was an indication of an accumulation from the bulls. However, the downtrend of April and the sharp selloff in May wiped out the notion of accumulation.
Conclusion
The market structure on the charts was firmly bearish. Bitcoin Cash is bound to follow Bitcoin’s trend, and if Bitcoin can not break out past the $30k and $32k levels in the weeks to come and instead drops below the $28.5k level once more, fresh lows can be expected for BCH as well.


