Bitcoin Cash, Cosmos, VeChain Price Analysis: 01 August

With Bitcoin soaring up to $42,000 today, other altcoins pumped too. BCH was preparing to test its immediate resistance, ATOM hiked by 8% overnight, and VET flashed signs of an uptrend.
Bitcoin Cash
BCH/USD, TradingView
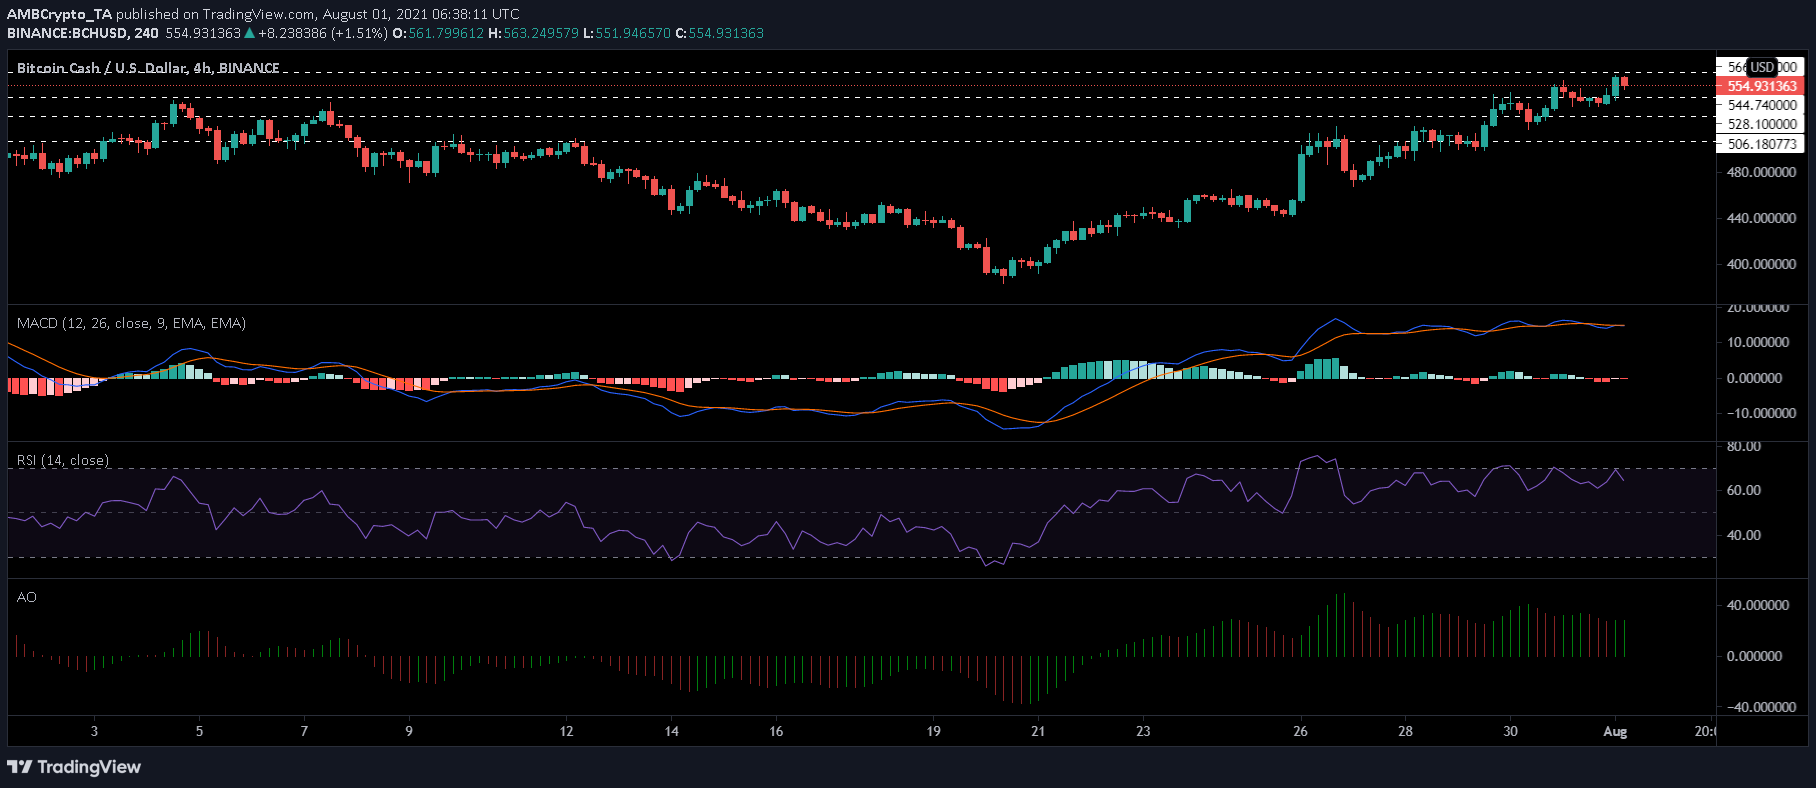
Bitcoin Cash was trading at $554 on the back of a 2.1% gain over the last 24 hours. From the 4-hour chart, BCH depicted an upward movement towards its immediate resistance of $566. On failing to test the same, the prices could land near the $544 mark and then subsequently rest on $528.
The Relative Strength Index despite noting a slight fall in buying pressure stayed well within the bullish territory. The green signal bars on the Awesome Oscillator depicted the presence of the bulls in the market.
Conversely, however, the MACD flashed red bars on the histogram at press time after a bearish crossover yesterday, although it was declining in size marking a reversal of the bearish sentiment on the indicator.
Cosmos (ATOM)
ATOM/USD, TradingView
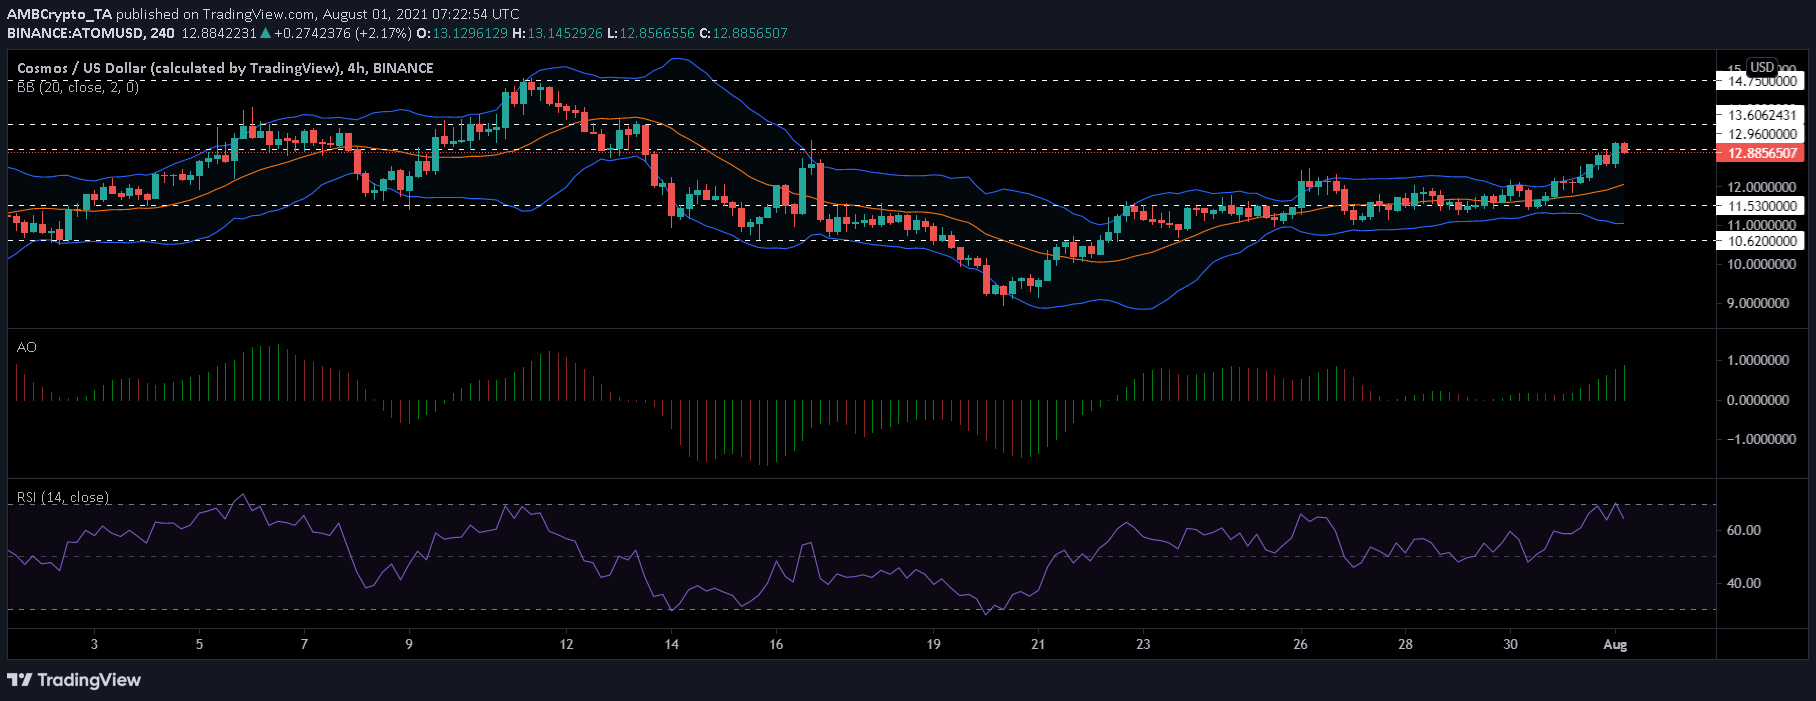
ATOM displayed a considerable hike of almost 8% within a day. It alt was priced at $12.88 at press time. If it continued moving on the upside, the token might cross the immediate price ceiling of $12.96.
If ATOM reaches the $12.96 mark over the upcoming trading sessions, it could expect strong resistance at $13.60. If the coin dips below its current price level, the support region lies at $12.00 and then eventually at $11.53.
Overall technical outlook of ATOM remained quite bullish with the Relative Strength Index spotted above 60 despite a minor fall. Awesome Oscillator showed amplified green signals bars validating the same.
Bollinger Bands widened suggesting chances of market volatility as prices kept touching the upper band.
VeChain (VET)
VET/USD, TradingView
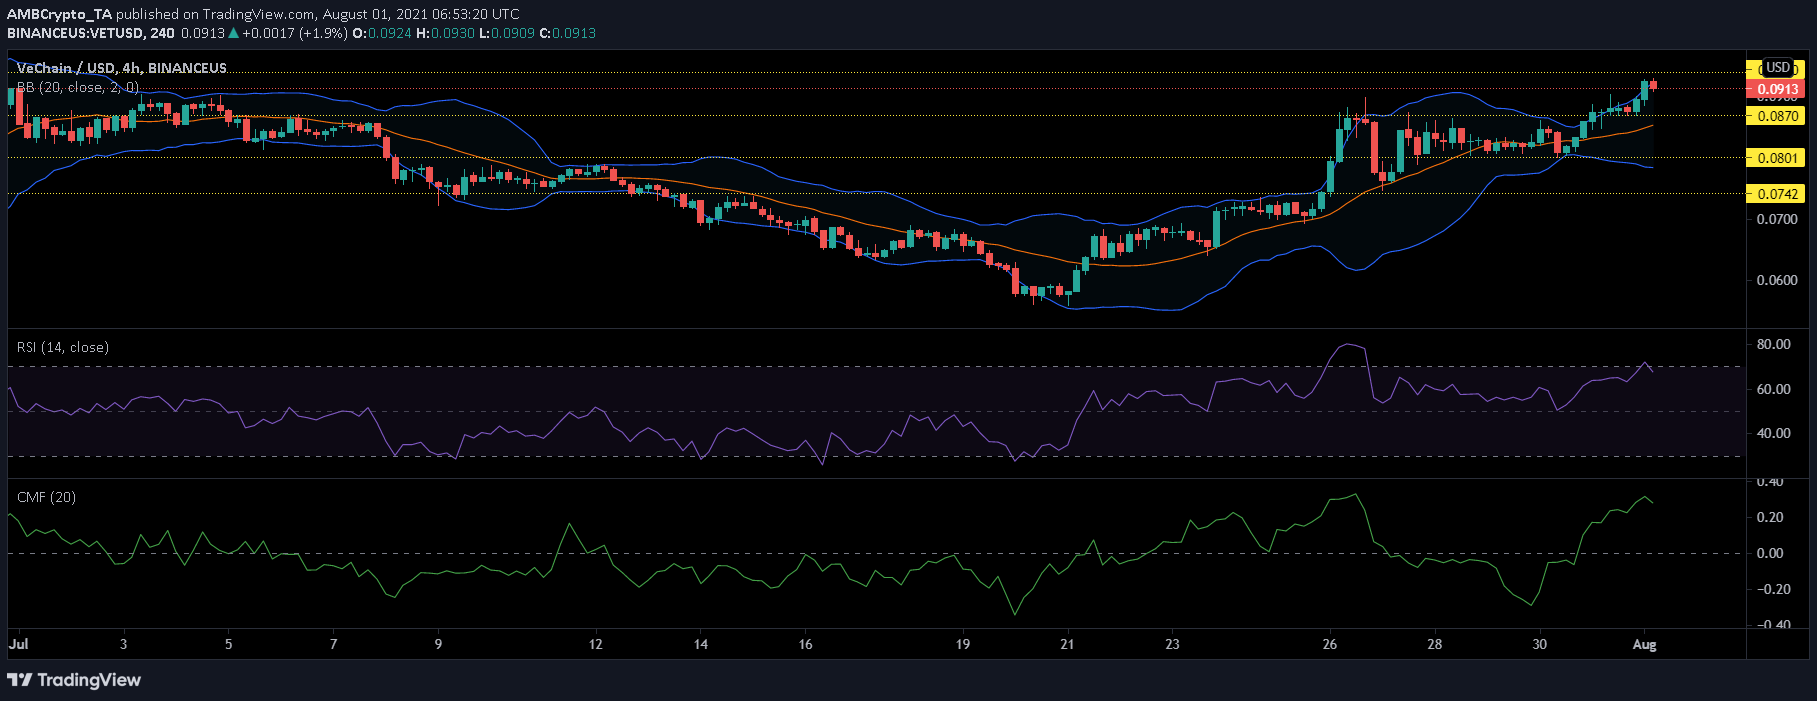
VET had seen a period of consolidation a few days back, however, it rebounded from that and registered steady gains over the last few days. VET’s price at press time stood at $0.0913 as it recorded a 5.2% gain overnight.
The technical analysis chart showed that VET witnessed a bullish trade, with the Relative Strength Index touching the overbought zone just 24 hours ago. At press time, however, the indicator fell below the overbought territory.
Chaikin Money Flow, over the last few days, registered increased capital inflows and was pictured in the bullish zone despite the minor fall in capital inflows at press time.
Bollinger Bands opened up in anticipation of increased market volatility. With prices touching the upper band, the bulls might push the prices higher. The immediate resistance for VET lay at $0.93, failing to test that, the support region awaited at $0.0870 and then at $0.801.


