Bitcoin Cash, Litecoin, Axie Infinity Price Analysis: 29 August

Bitcoin Cash and Litecoin registered gains following the recoveries noted by Bitcoin and Ethereum. BCH gained a substantial 7.5% while eyeing the next price ceiling at $722.90. Litecoin, after recording a 2.7% increase, traded near its $180.87 resistance mark.
Some altcoins, however, displayed consolidation on their respective charts. For instance, AXS declined 0.8% and exhibited constricted price action.
Bitcoin Cash (BCH)
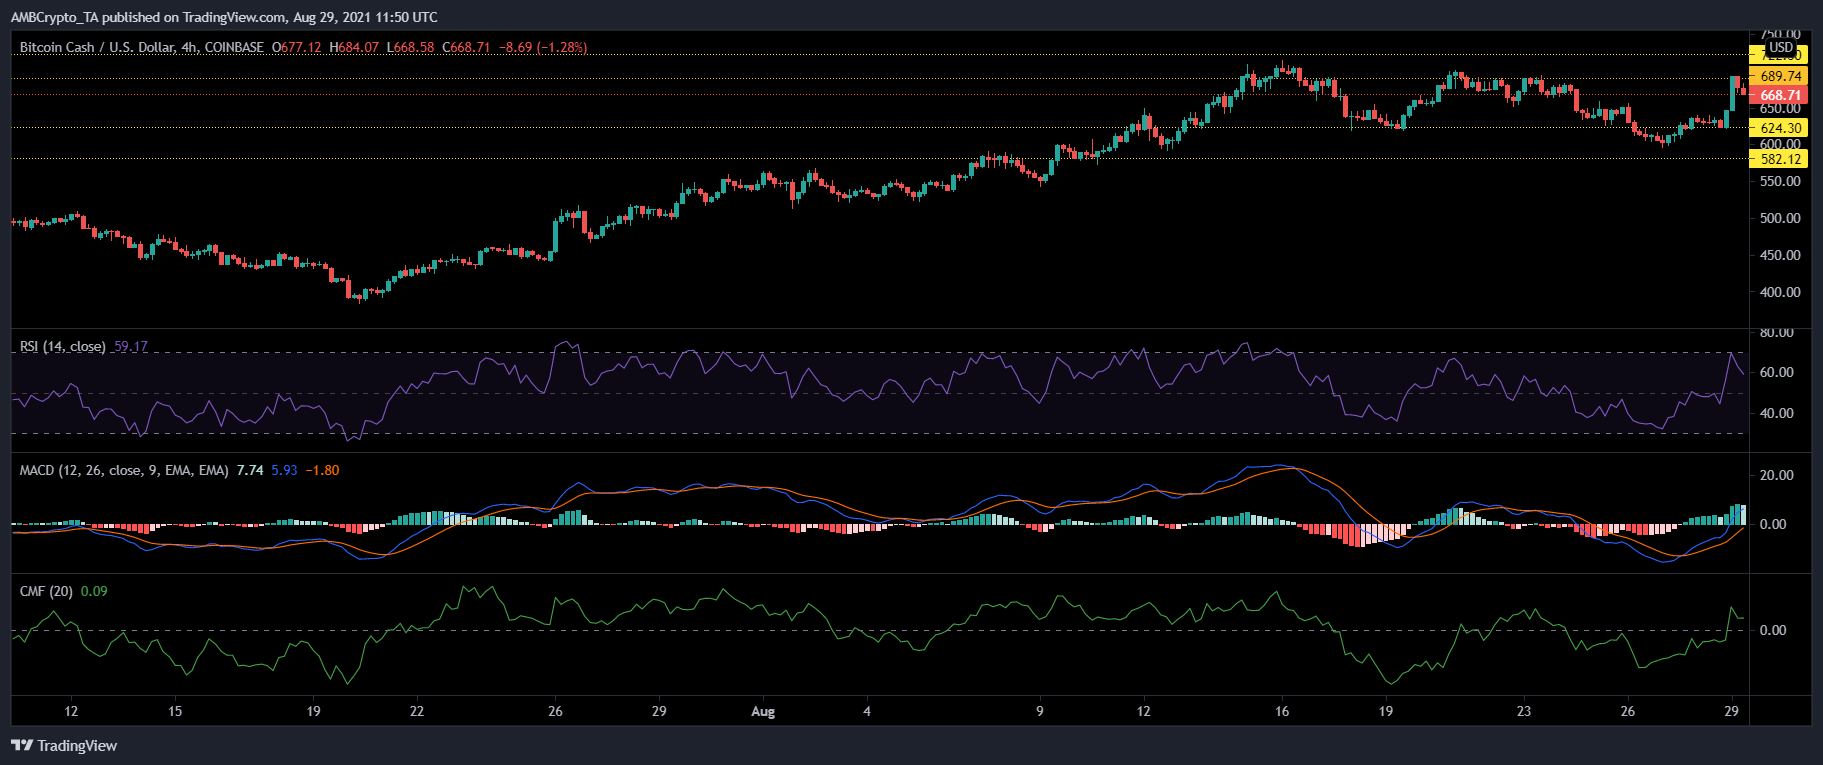
BCH was trading at $668.71 after it logged a 7.5% gain over the last 24 hours. A continued uptrend could push BCH to retest the $722.90 resistance mark. Technical parameters show bullishness in the market.
Relative Strength Index stood at 60, in bullish territory. Green bards on MACD‘s histogram grew, indicative of positive price action. Chaikin Money Flow remained above the half-line.
In the case of BCH failing to sustain at the current price level, prices would land at $624.30 and then at $582.12 respectively.
Litecoin (LTC)
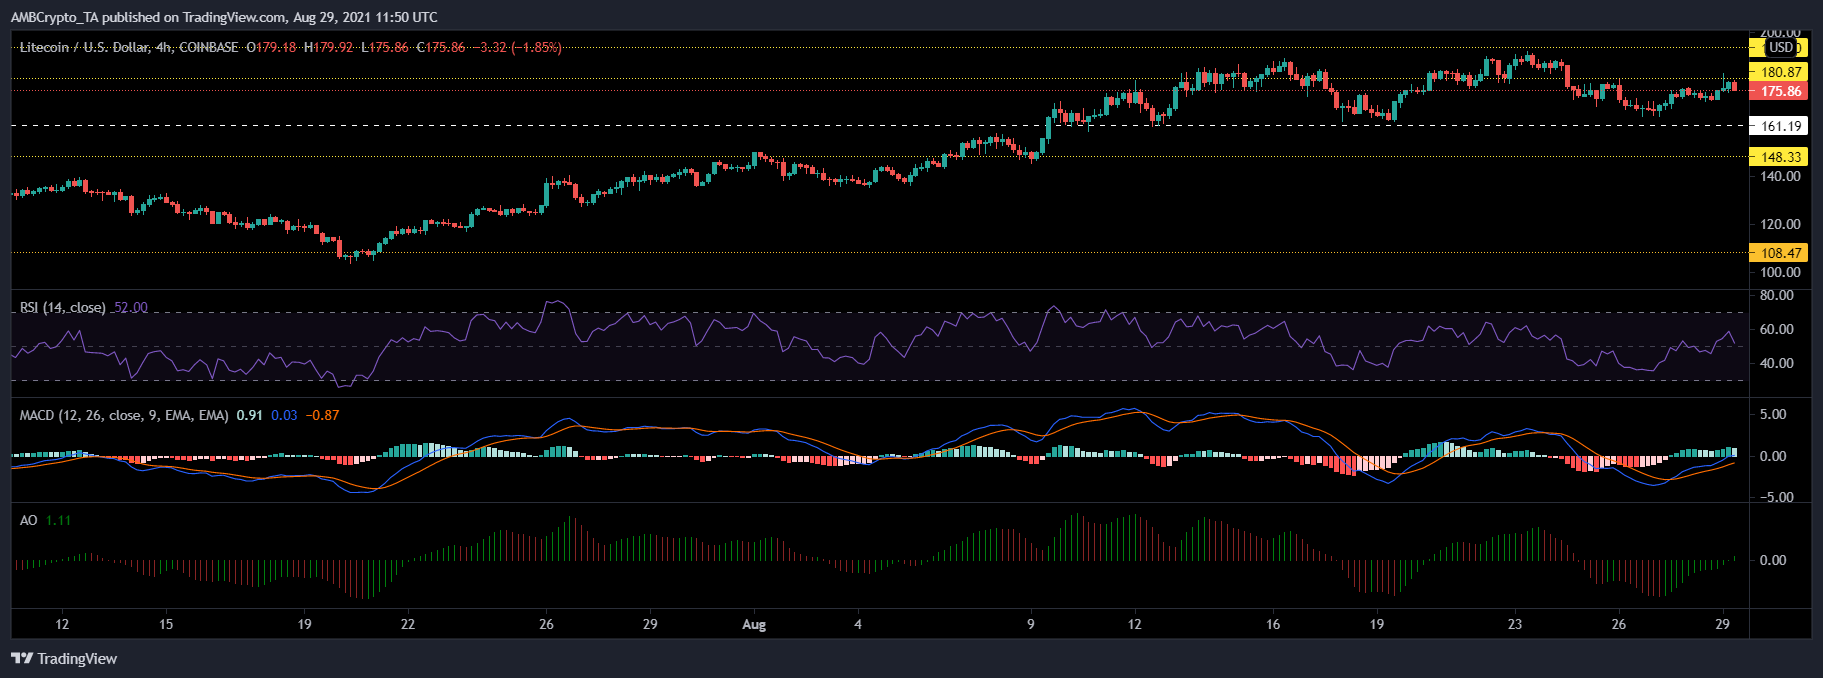
Litecoin climbed 2.7% over the last 24 hours and was priced at $175.86. It eyed the immediate price ceiling of $180.87, toppling which, the coin could attempt to test the $193.70 mark. Indicators signaled positive price action for LTC.
Relative Strength Index was seen above the 50-mark, within the bullish zone. Awesome Oscillator continued to flash green signals. MACD also depicted green bars on its histogram, affirming the above readings.
If buyers lose strength in the market, LTC could fall and rest on $161.19 and then on the $148.33 price floor.
Axie Infinity (AXS)
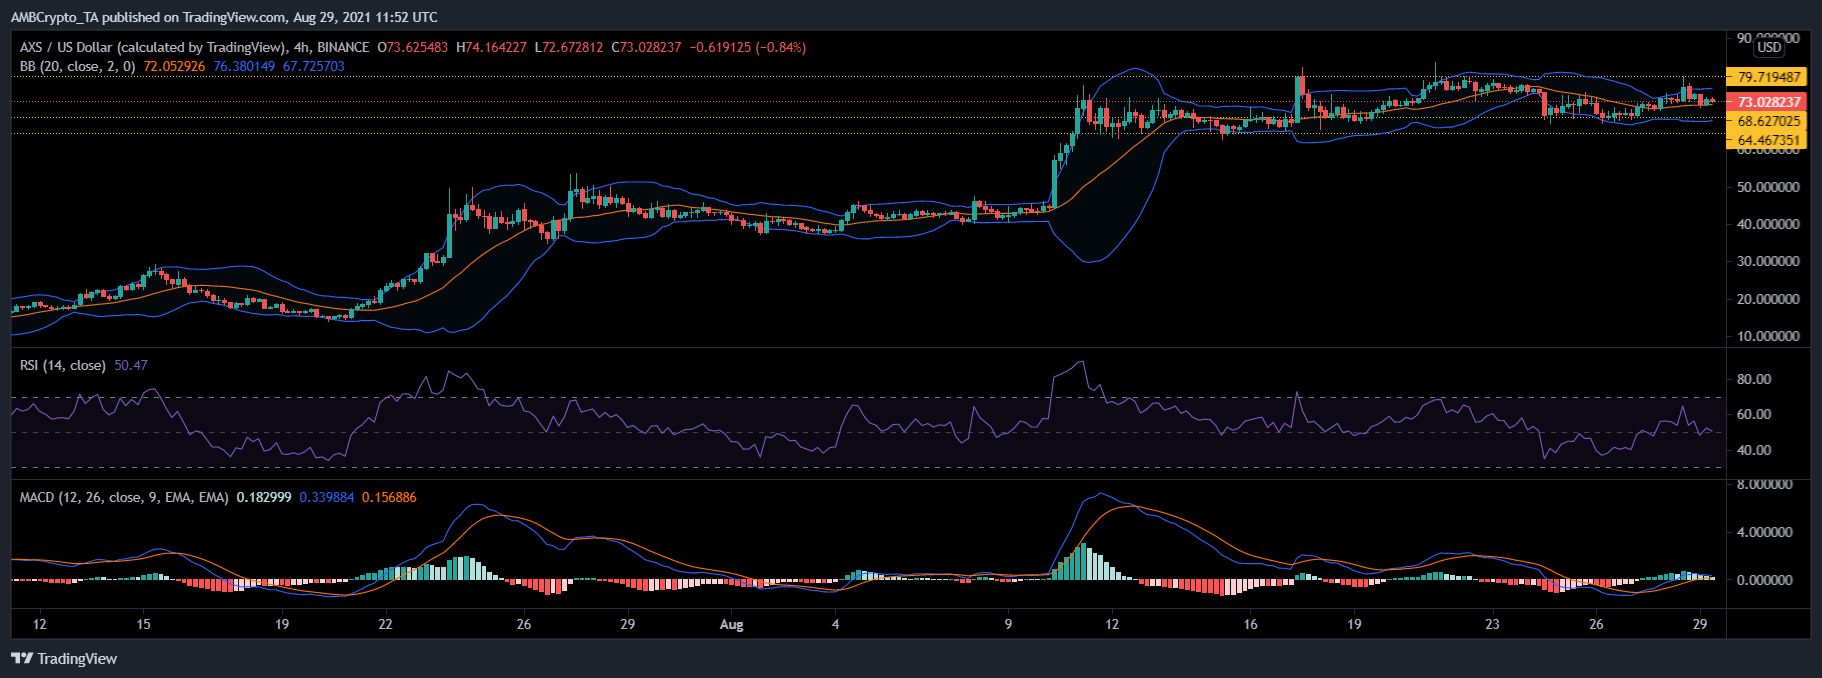
Axie declined by 0.7% and demonstrated consolidation, prices stood at $73.02. Bollinger Bands, in congruence to the same, also displayed constriction. The range-bound movement could cause Axie to oscillate between $79.71 and $68.62.
Relative Strength Index signaled that buying strength hadn’t fizzled out completely as the indicator stood above the 50-mark.
MACD flashed smaller green bars on its histogram in accordance with a downward range-restricted price movement. A break on the upside could cause AXS to trade near its $79.71 resistance mark.