Ethereum, Polkadot, Litecoin Price Analysis: 28 August

Bitcoin and Ethereum spurred a cascading effect in the broader market as the coins stood above $48K and at $3238.42, respectively. Polkadot rose by 4.7% and prepared to test the $26.74 resistance mark, while Litecoin also flashed bullishness as it inched closer to its immediate price ceiling of $180.87.
Ethereum (ETC)
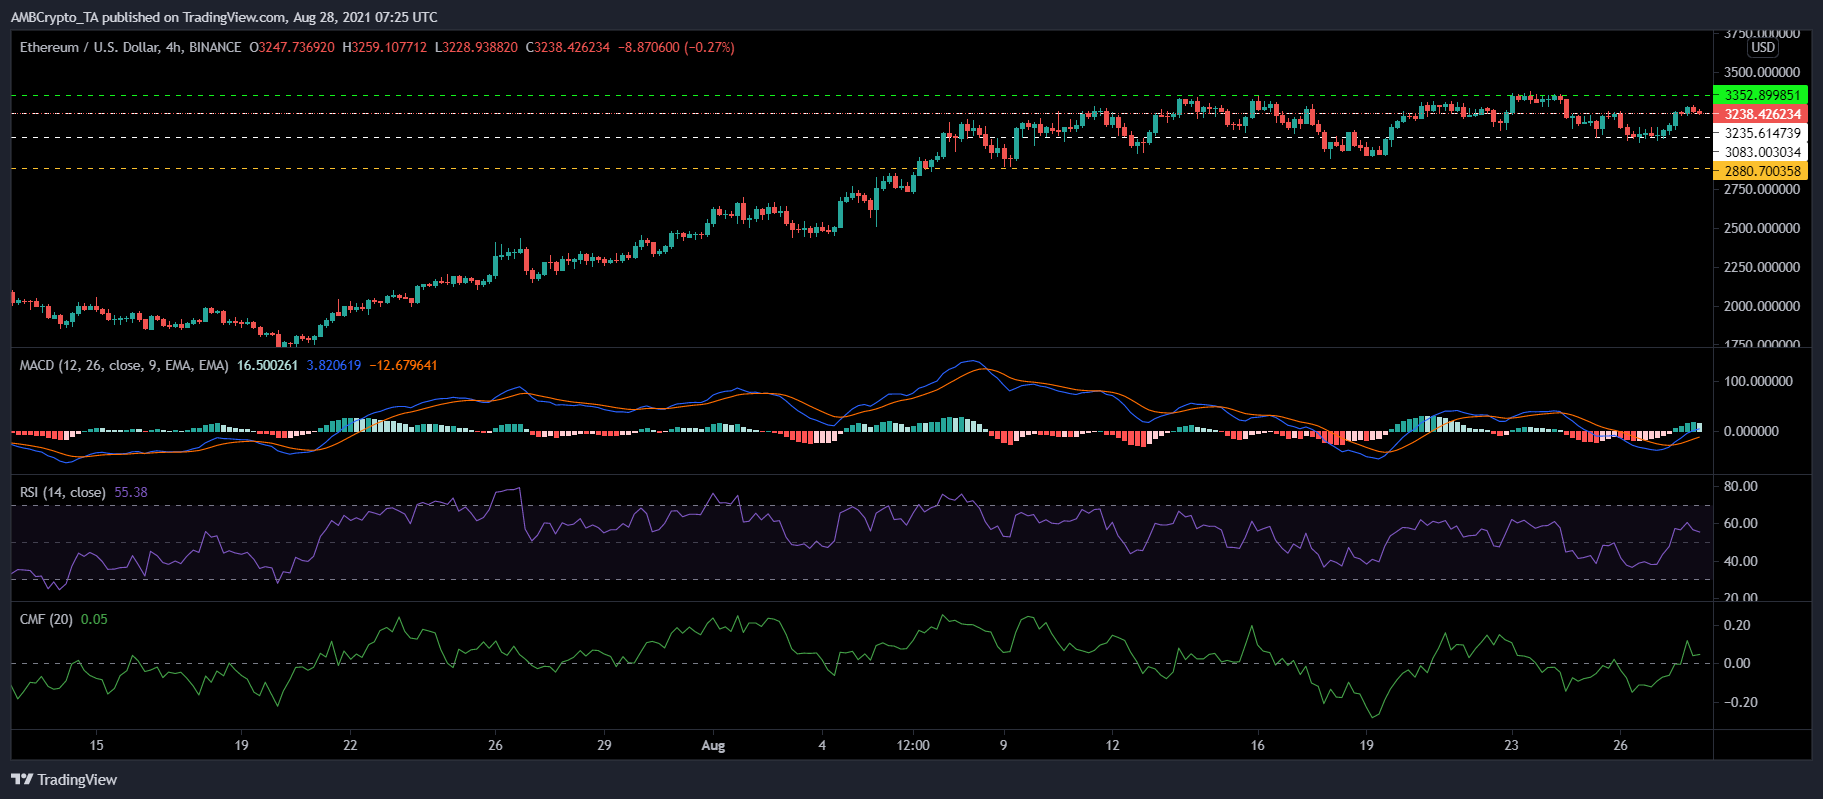
Ethereum recovered its recent losses by 3.9%, over the last 24 hours and prices stood at $3238.42. After observing a positive price reversal, ETH toppled over the $3235.61 resistance mark. It could retest the $3352.89 mark with an ongoing uptrend. Technical parameters pointed towards a positive price action.
Relative Strength Index stood above the half-line after buying pressure revived. Correspondingly, Chaikin Money Flow was also pictured in the bullish territory, above the midline, as capital inflows increased.
MACD underwent a bullish crossover and flashed green bars on its histogram. In case ETH witnesses a pullback in prices again, support levels await at $3083 and $2880.70 respectively.
Polkadot (DOT)
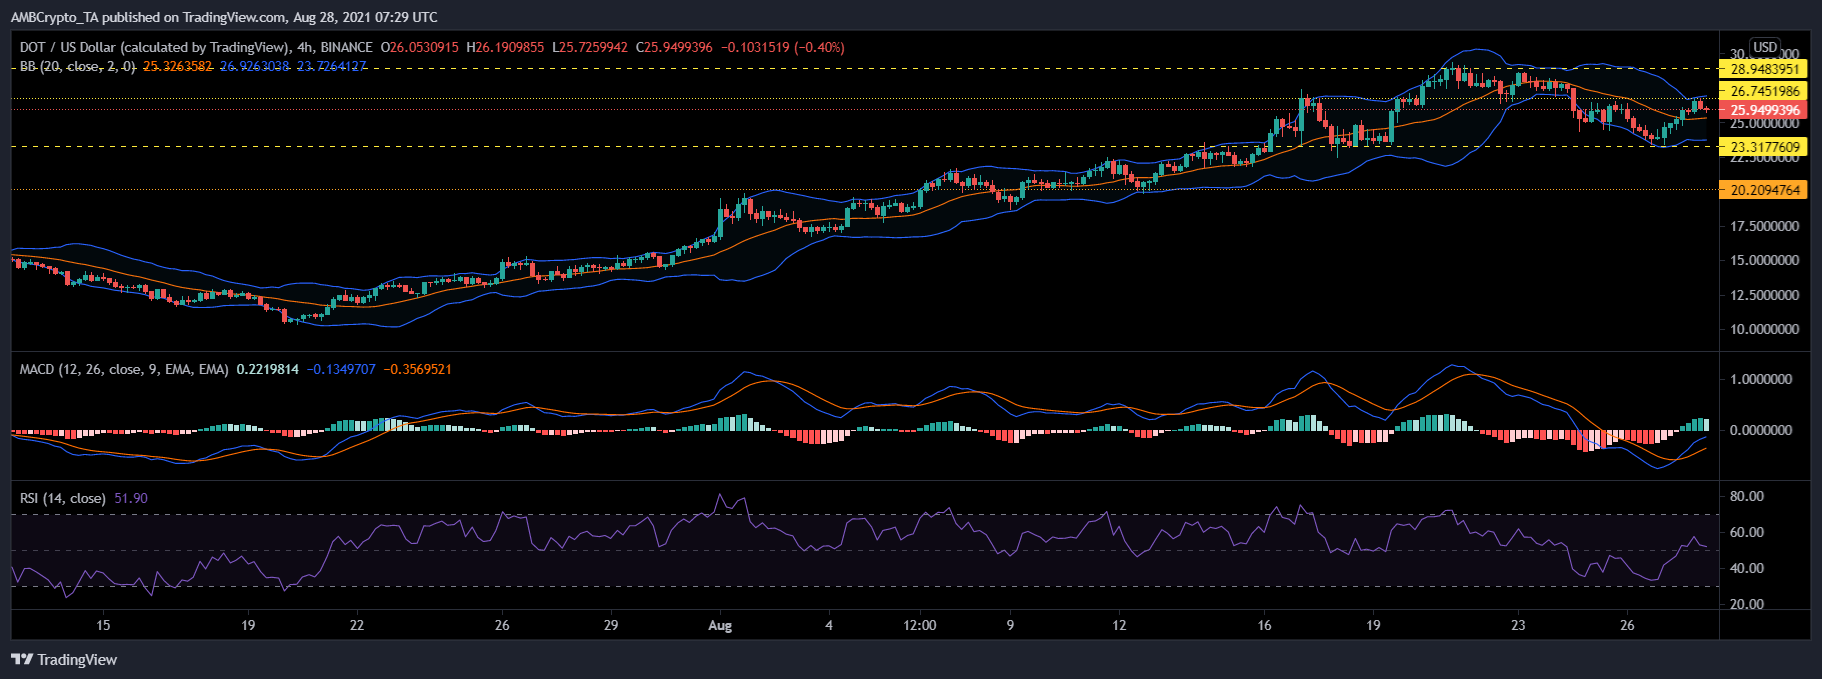
DOT moved up by 4.7% on its chart, in the last 24 hours and was trading at $25.94. The alt was trading close to its immediate resistance of $26.74. If it breaks above the $26.74 mark, it could attempt to test the $28.94 mark.
Indicators for DOT remained bullish. MACD displayed green histograms while buying strength recovered as the Relative Strength Index climbed above the half-line.
Bollinger Bands, however, depicted chances of range-bound movement as the indicator remained constricted. Prices could hover between $26.74 and $23.31 in case the above notion holds true.
On the flip side, if DOT loses positive momentum it could land on the $23.31 and $20.20 support levels.
Litecoin (LTC)
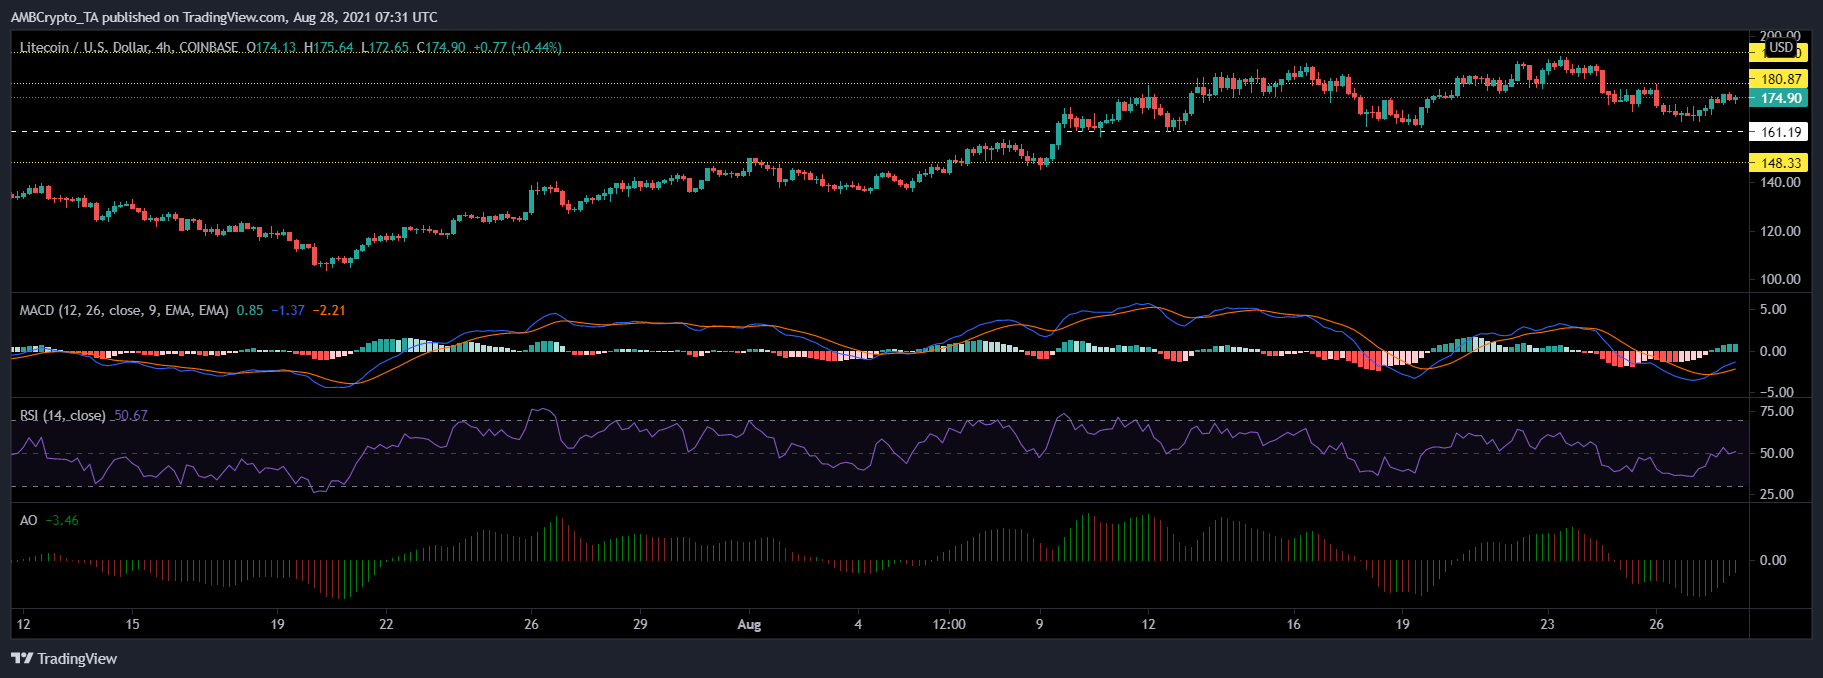
Litecoin was trading for $174.90, after appreciating by 3.4% since the last day. The token prepared to move closer to its immediate resistance of $180.87. Upon toppling it, the coin could trade near the $188.70 mark.
This recovery in price was reflected in the technicals of LTC. MACD observed green bars on its histogram. Awesome Oscillator too displayed green signal bars affirming a price recovery.
Relative Strength Index climbed above 50 due to upwards pressure in buying strength. In case buying pressure fails to recover, the support zone for LTC can be between $161.19 and $148.33 respectively.