Bitcoin Cash, Litecoin, Binance Coin Price Analysis: 20 September

As Bitcoin recorded a dip and was trading slightly above the $45K mark, altcoins also registered losses. Bitcoin Cash fell by 9.2% and had revisited the price that it last touched one and a half month ago. Litecoin also depreciated and was trading near its one month low price. Lastly, Binance Coin registered a 5.1% fall and was priced close to its one-week low mark.
Bitcoin Cash (BCH)
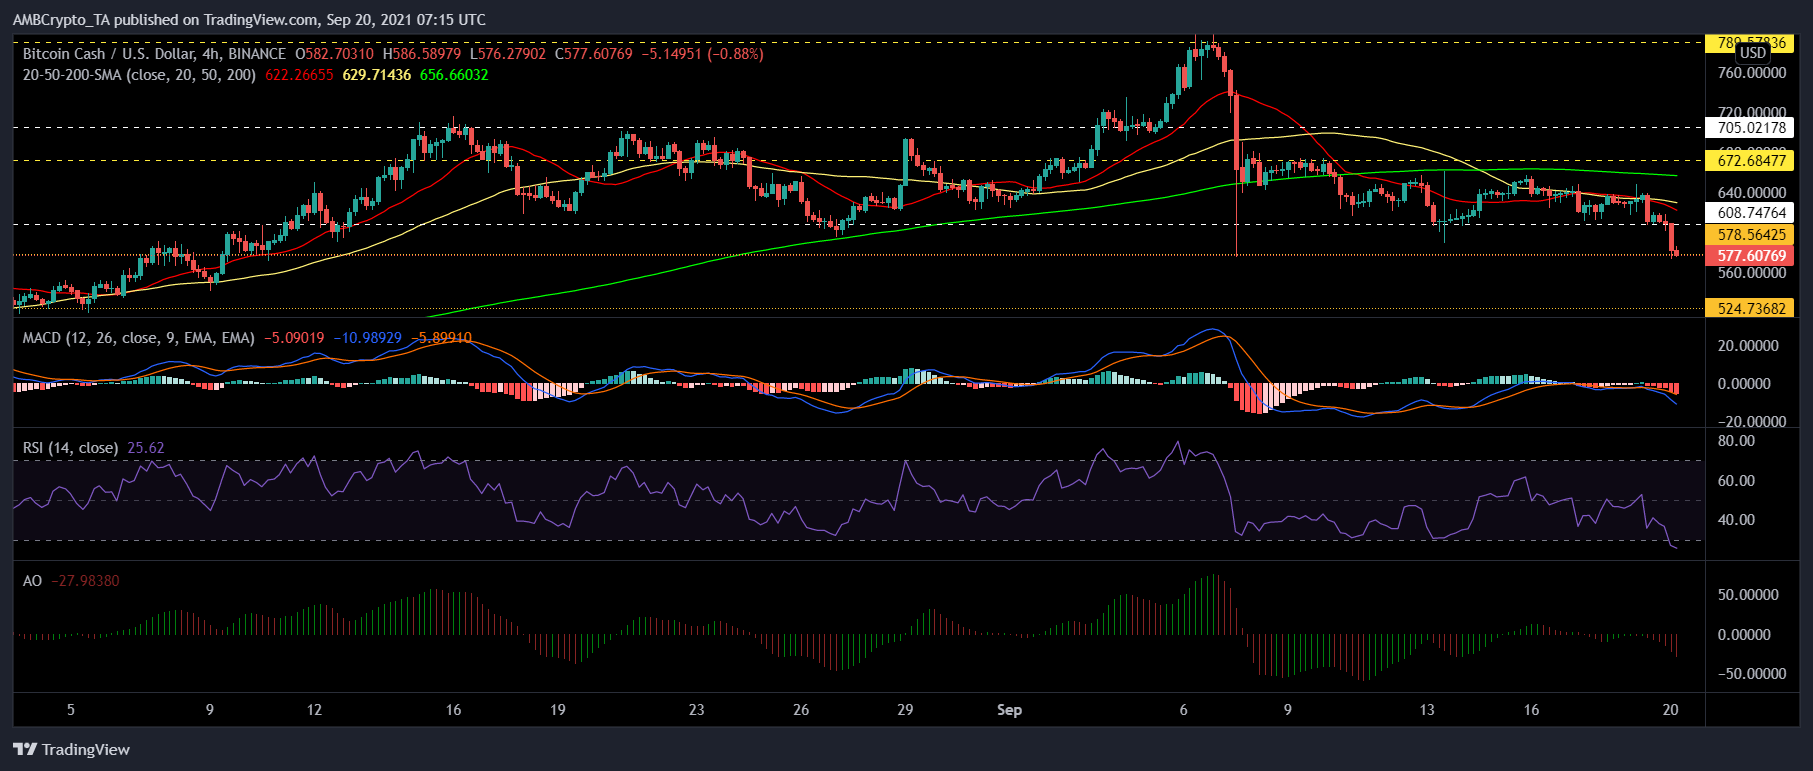
Bitcoin Cash declined by a considerable 9.2% over the last 24 hours. The altcoin was trading for $577.60, a level it last touched almost over a month ago. The immediate support level for Bitcoin Cash lay at $524.73, which also marks a one and a half month low for the altcoin.
On the four-hour chart, the price of BCH was below the 20-SMA line suggesting that the price momentum favored sellers. In correspondence, the Relative Strength Index was seen inside the oversold territory. The indicator was on a multi-month low. MACD flashed red bars on its histogram.
The Awesome Oscillator also observed red signal bars. In case of a price reversal, the immediate resistance level was at $608.74. Other price ceilings stood at $672.68 and at $705.02 respectively.
Litecoin (LTC)
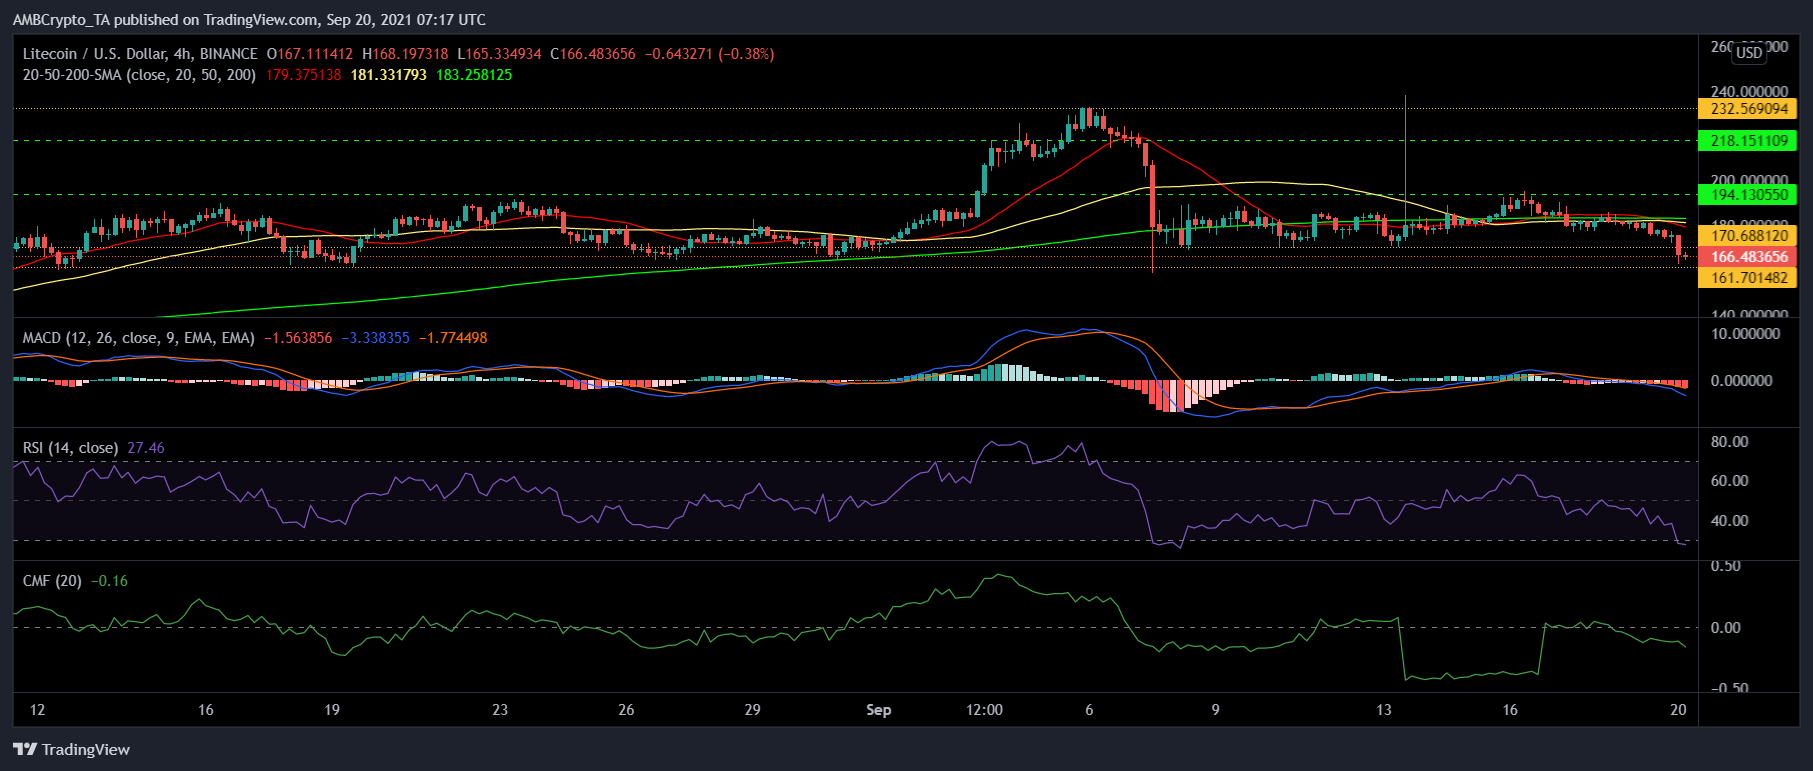
Litecoin also depreciated 7.5% over the past day and was trading at $166.48. The nearest support line for the coin was at $161.70, which also happens to be the one-month low price for the altcoin. Litecoin had witnessed a sharp sell off and on the four-hour chart, LTC’s price was seen below the 20-SMA line, affirming the same.
Relative Strength Index was parked inside the oversold zone. Chaikin Money Flow was also seen underneath the half-line as capital inflows were negative. MACD flashed red bars on the histogram.
In the event of buying pressure recovering, Litecoin’s immediate resistance lay at $170.68. Additional resistance levels for LTC were at $194.13 and $218.15, respectively.
Binance Coin (BNB)
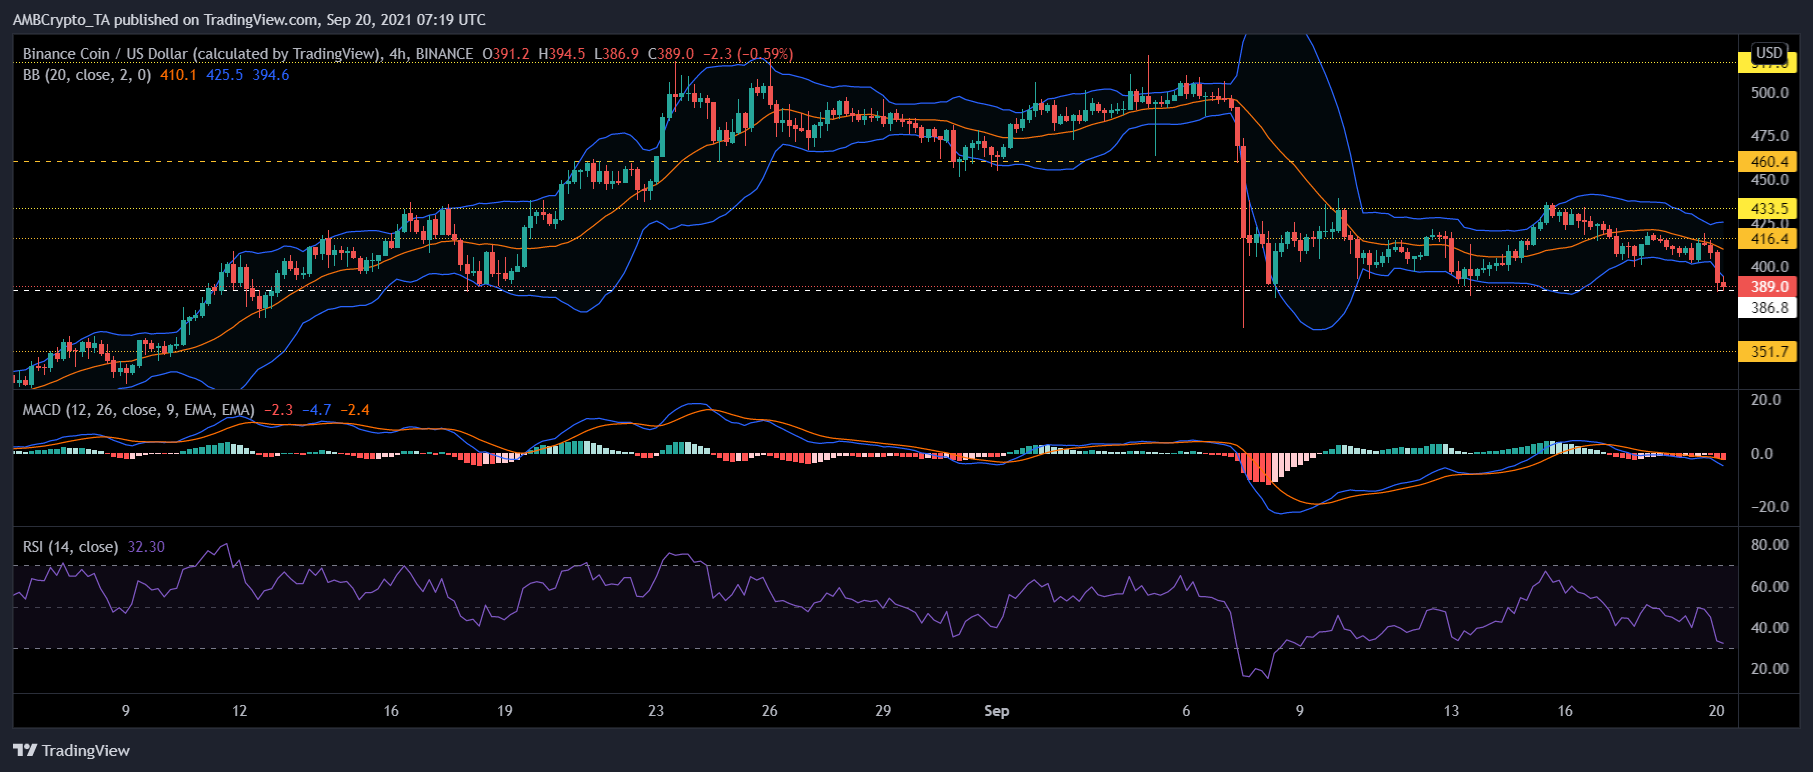
Binance Coin registered a 5.1% decline over the last 24 hours. The price of BNB stood at $389, at its one-week low. A fall below the current price level would land BNB on $386.8 and then at its one and a half month low of $351.7.
Relative Strength Index was in the bearish zone and the indicator could head into the oversold zone. MACD displayed red bars on the histogram.
Bollinger Bands diverged indicating that price volatility could be on the rise over the upcoming trading sessions. On the upside, BNB’s immediate price ceiling stood at $416.4. Toppling over the aforementioned resistance mark, Binance Coin could aim to retest the $433.5 and $460.4 resistance levels respectively.


