Bitcoin Cash, MATIC, ZCash Price Analysis: 11 July

Bitcoin Cash, MATIC, and Zcash’s trading volumes fell by 34.07%, 32.02%, and 3.17% respectively, over the last 24 hours. BCH noted no considerable price movement over the last few days, however, while MATIC was on a downtrend despite some buying pressure. Finally, Zcash registered some market weakness.
Bitcoin Cash [BCH]

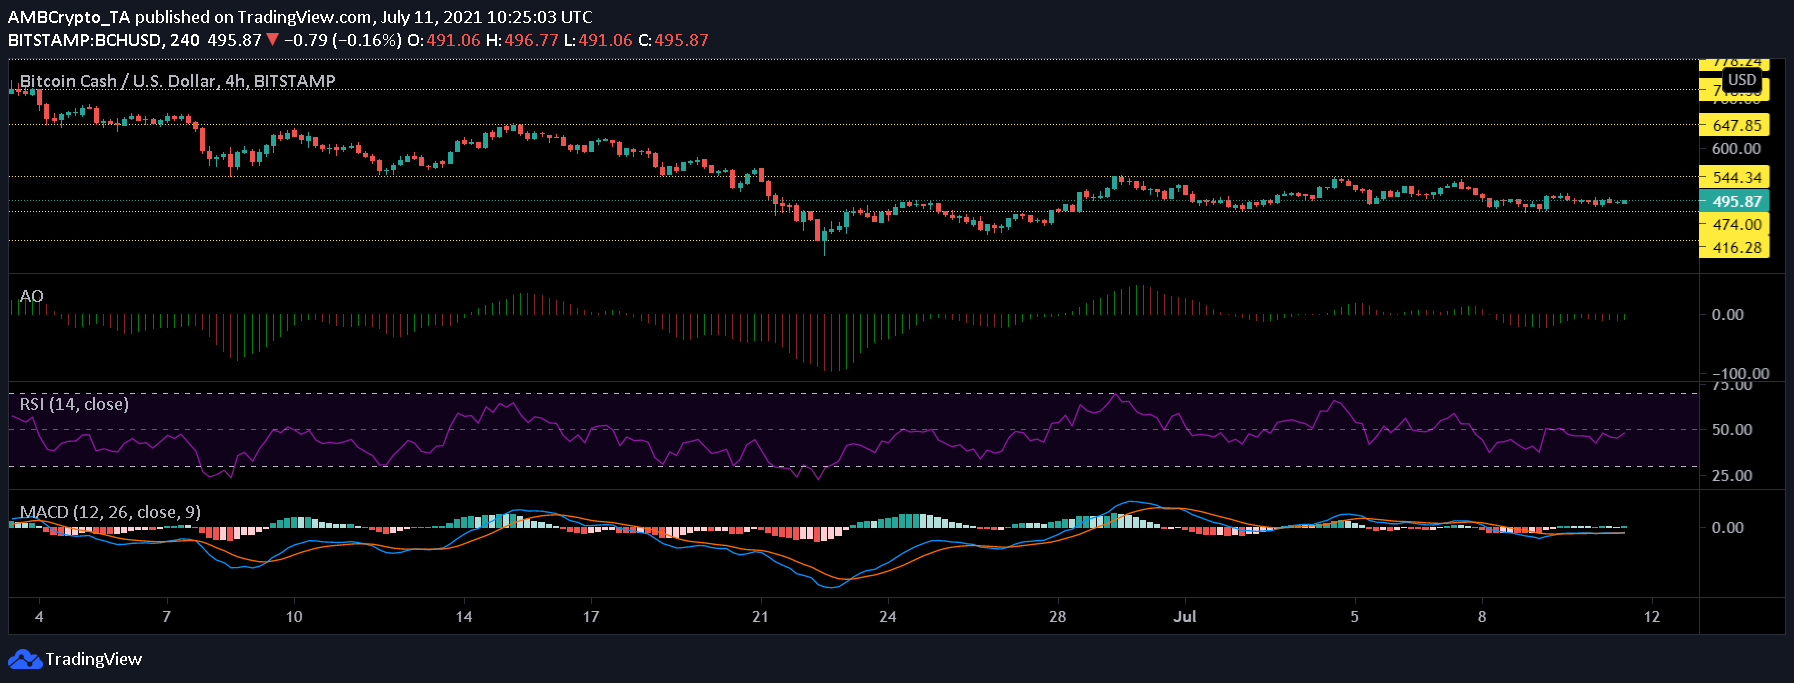
BCH/USD, TradingView
BCH was trading sideways, despite experiencing price corrections on 23 June. The token has been moving directionlessly for the last couple of weeks. At press time, Bitcoin Cash was moving to find its base rested on its crucial support level of $475. At press time, the altcoin was trading at $495.87. Its value fell by 0.5% and consistent movement along the same pattern will push the price down below $475 soon.
Mixed signals were spotted on the Awesome Oscillator as red signal bars popped up fitfully due to bearish trading sessions in between bullish trading sessions. Buying pressure increased faintly, at the time of writing, as the Relative Strength Index noted a tiny uptick.
A bullish crossover was observed on 9 July, following which, short-term bullish momentum was seen on the MACD indicator. However, bullish momentum had started to decline at press time. Overall, no significant momentum was spotted for BCH.
MATIC

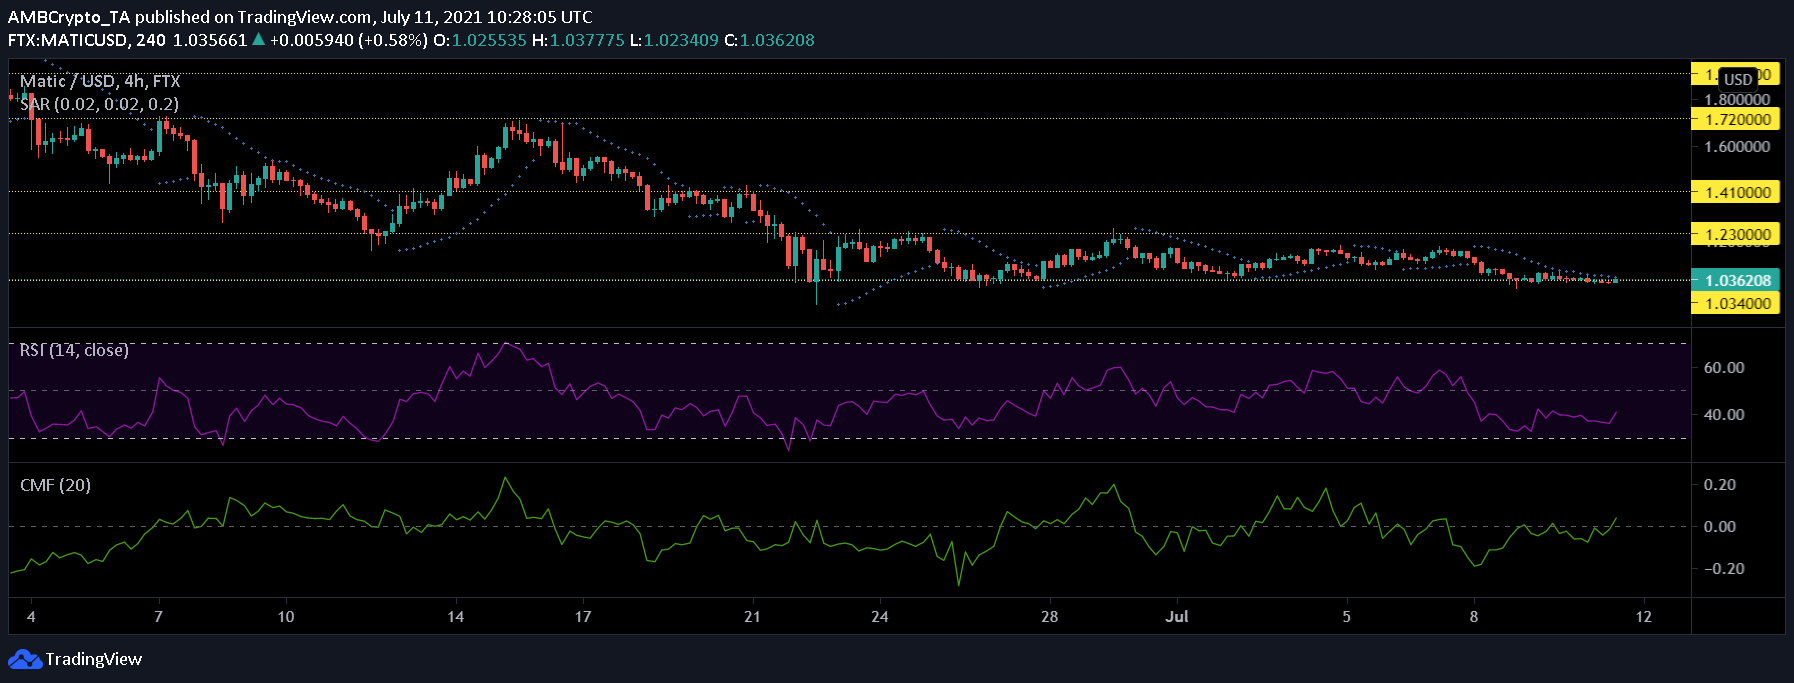
MATIC/USD, TradingView
After some range-bound movement, the market bears pushed MATIC’s price below its crucial support level of 1.03, at press time. The price was observed to be oscillating between $1.03 and $1.02. This marked an 8% decline in price over the past week. MATIC’s trading volume also took a significant dip on the charts.
Selling pressure emerged over the last few days. However, since the price saw absolutely no change over the past 24 hours, buyers again found themselves purchasing the token. The Relative Strength Index pictured a small increase in buying pressure at press time. In correspondence to the buying pressure, the Chaikin Money Flow also registered a hike in capital inflows.
With the price descending since yesterday, the Parabolic SAR showed that the dotted lines were above the price levels, a finding which confirmed a downtrend on the charts.
Zcash [ZEC]

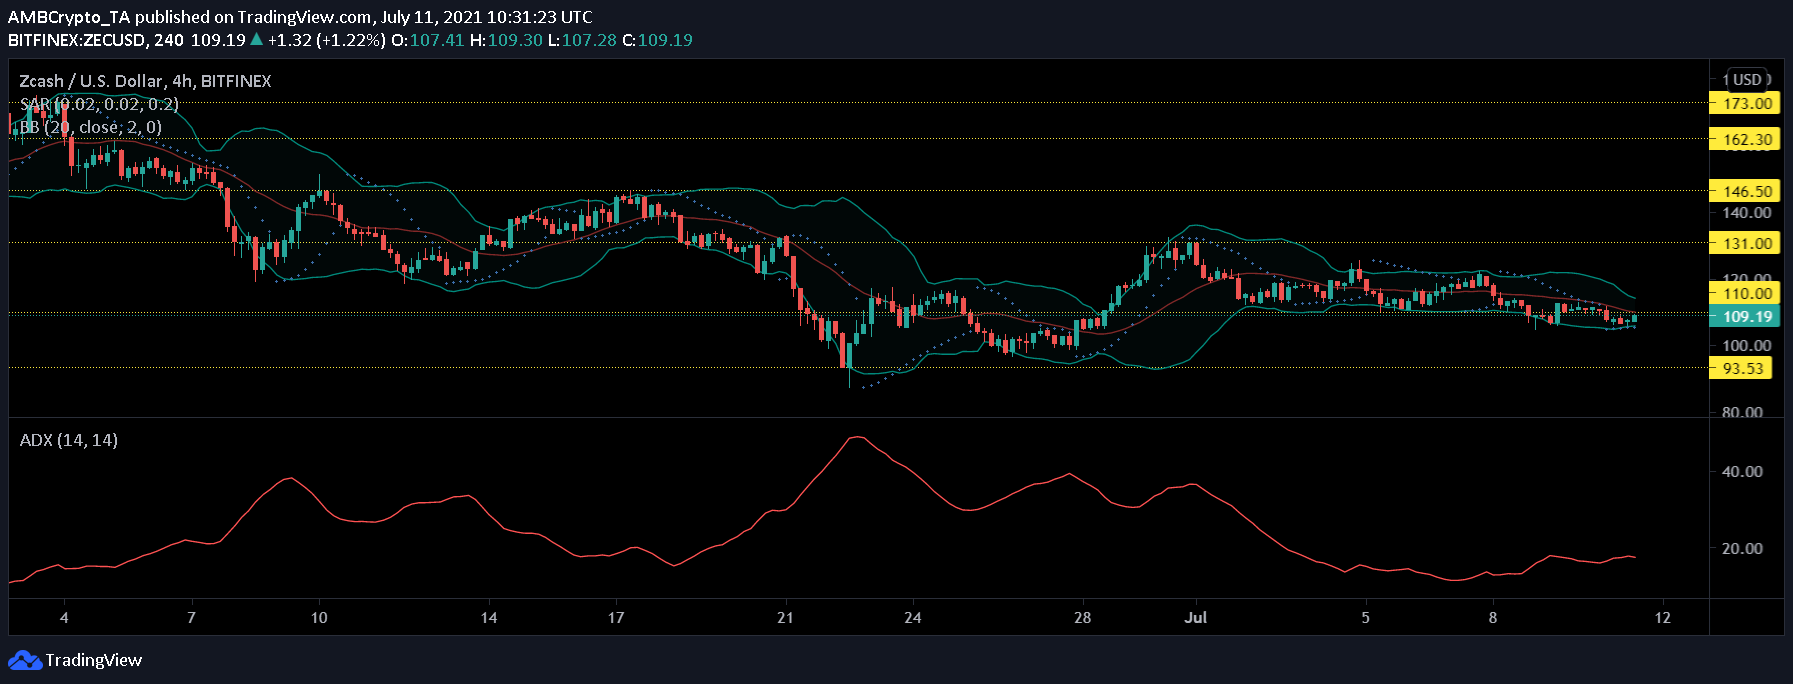
ZEC/USD, TradingView
Post price recovery on 23 June, ZEC’s prices consolidated between the $110 and $131 support and resistance levels. At press time, the coin was trading below the support level of $110, however. ZEC was priced at $109.19, and if the bulls fail to gain strength, it can fall down to the $93.53 support level.
The dotted lines of the Parabolic SAR were visible below the candlesticks, a sign of an uptrend. The Bollinger Bands flashed a different signal, however, as the indicator tightened and pointed to low market volatility. If the price rises, the next resistance level for ZEC would be at $131.
The Average Directional Index affirmed the trendless price action of the alt as the indicator remained below the 20-mark at the time of writing.


