Bitcoin Cash, Stellar Lumens, Neo Price Analysis: 13 May

As expected, Bitcoin finally broke out of its trading range above $55,000 on the price charts over the last few hours. Alas, contrary to expectations, Bitcoin broke out in the southbound direction, with the world’s largest cryptocurrency falling well below $51k.
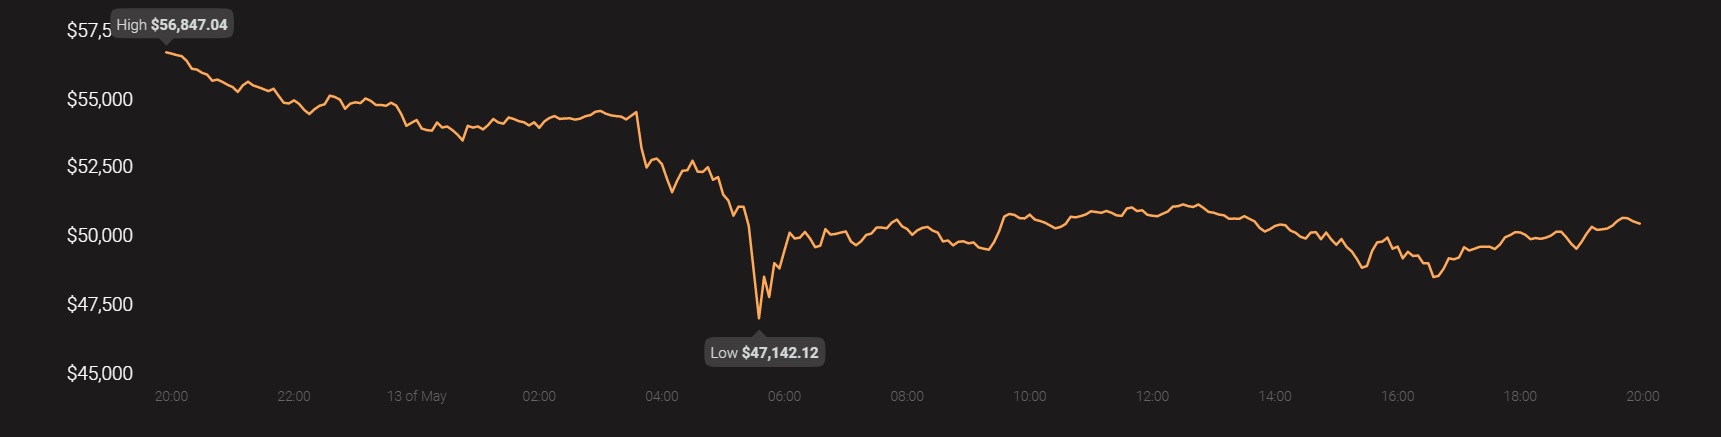
The said development had a corresponding effect on the likes of Bitcoin Cash, Stellar Lumens, and Neo.
Bitcoin Cash [BCH]
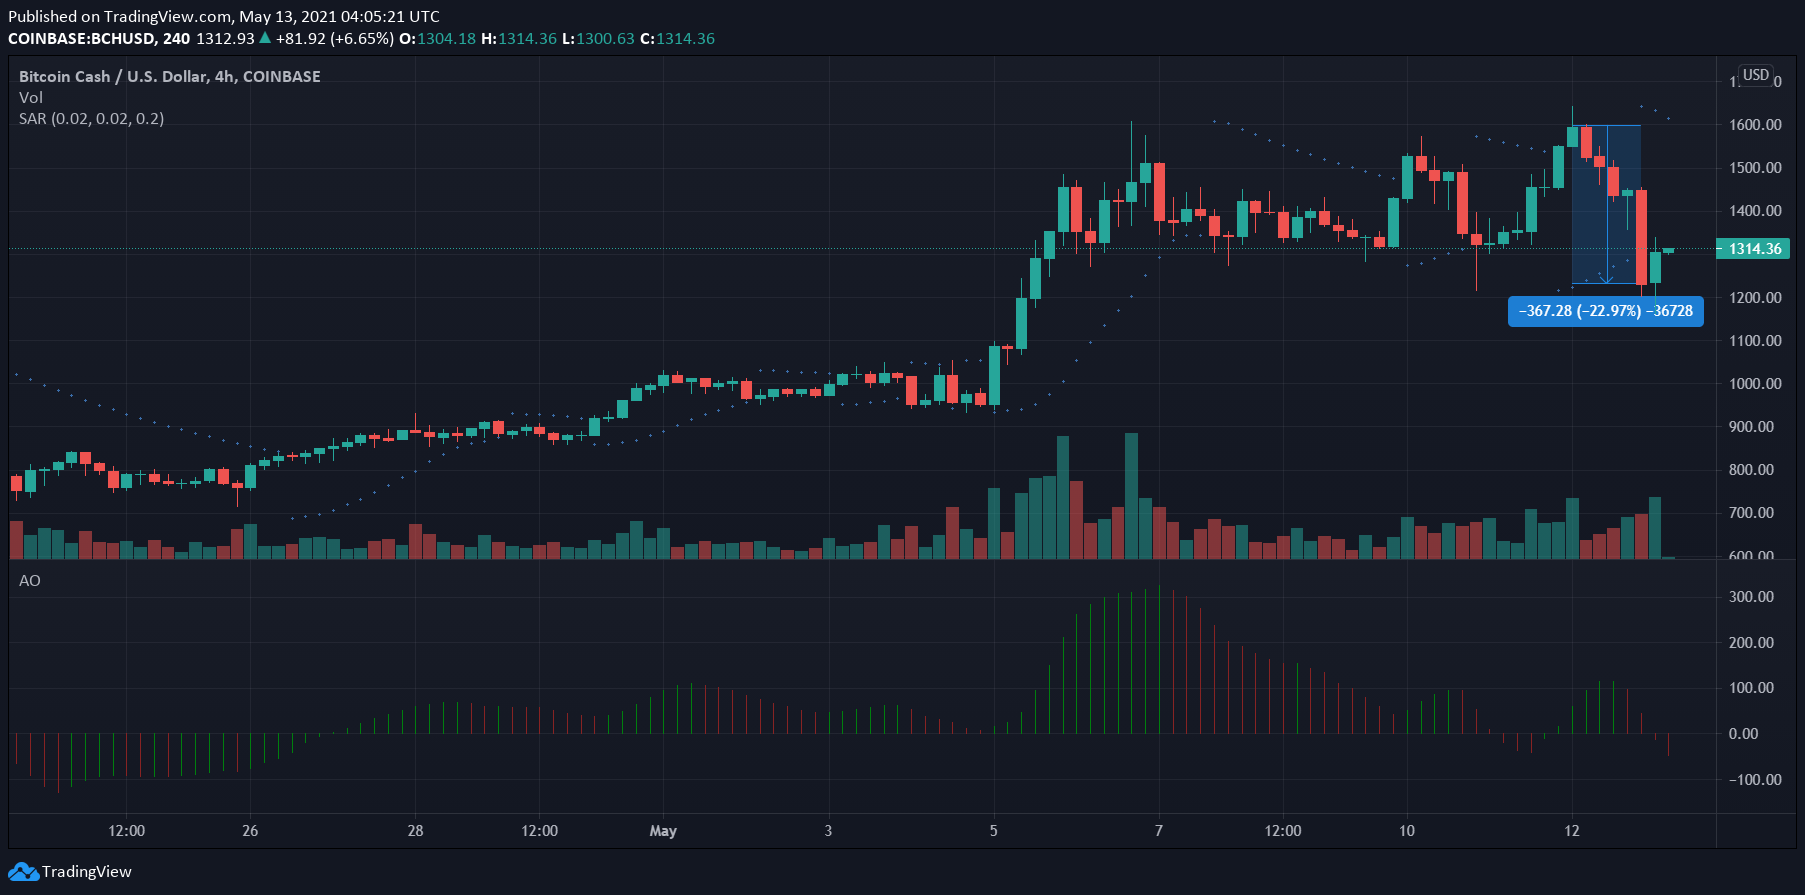
Bitcoin Cash, the popular fork of the king coin, has been one of the many alts to hike on the charts this year, with BCH registering YTD returns of 271%, at press time. While the last few days did see BCH trade within a tight price band, the said trend was broken when Bitcoin corrected on the charts. Thanks to the same, BCH fell by almost 23% in less than 24 hours.
At press time, some recovery was afoot. However, it was too early to ascertain whether this amounted to a trend reversal.
While the Parabolic SAR’s dotted markers were well above the price candles, the Awesome Oscillator pictured falling momentum, with the histogram dropping below the half-line.
The altcoin was in the news recently after Bitcoin Cash Argentina announced a flipstarter campaign to raise awareness about the cryptocurrency in the country.
Stellar Lumens [XLM]
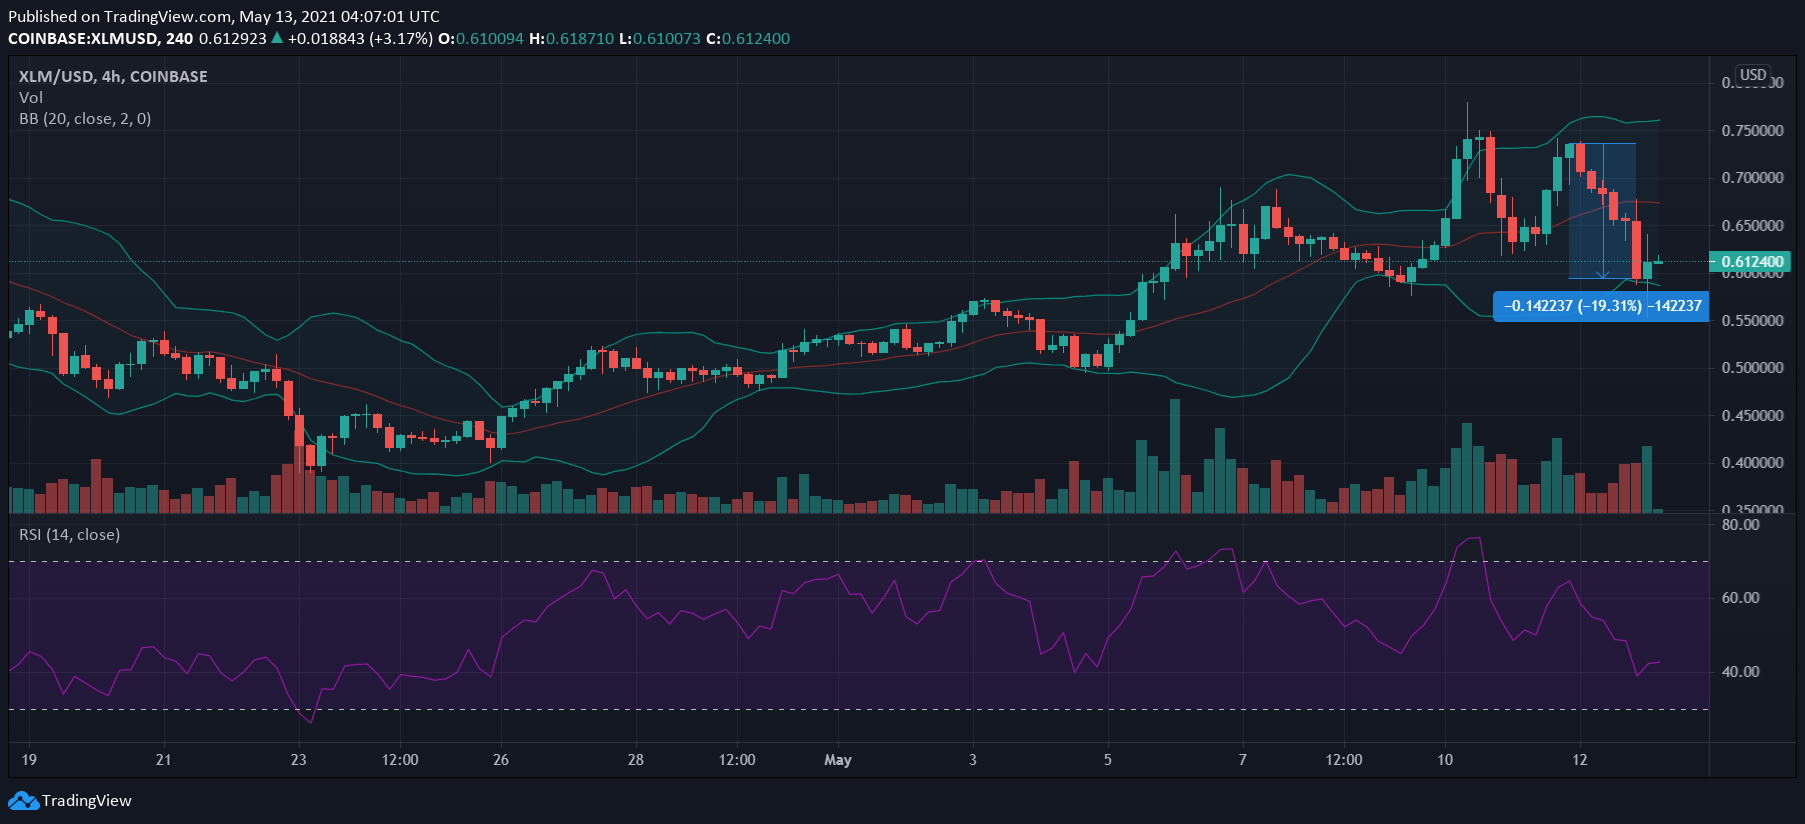
XLM, the cryptocurrency ranked 15th on CoinMarketCap’s list, has had a topsy-turvy price action over the past few months, with its many price hikes being followed by a series of sharp falls. The Bitcoin-fueled depreciation over the last 24 hours was just the latest such event, with XLM dropping by over 19% on the charts.
Here, it’s worth highlighting that trading volumes have remained fairly consistent over the past few trading sessions. Maintaining said levels would be crucial for a bullish leg.
While the mouth of the Bollinger Bands was wide enough to project some incoming price volatility, the Relative Strength Index was holding a position close to the oversold zone – A sign of sellers enjoying greater strength in the market.
Needless to say, recent developments such as the SDF working with Circle and Visa to give users easy access to their funds in digital wallets hasn’t had an effect on the alt’s price movement.
Neo [NEO]
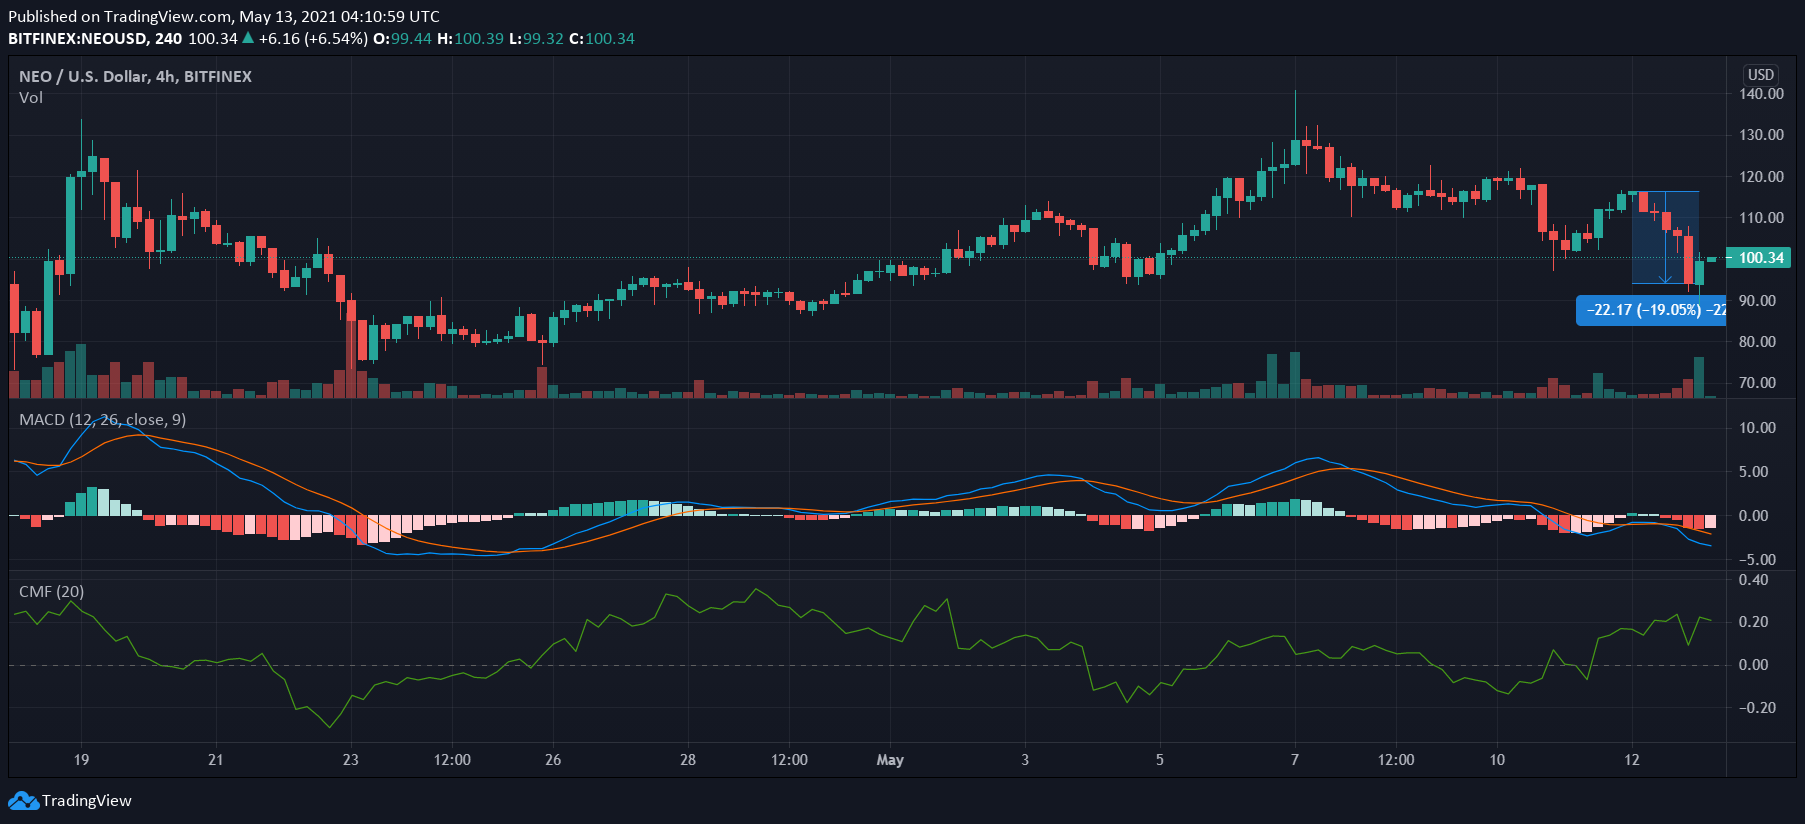
With YTD returns of over 565% at press time, Neo has been one of 2021’s best performers in the crypto-market. Over the past week or so, however, the altcoin has been on a downtrend on the charts, with the last few trading sessions seeing the crypto drop by almost 20% on the charts.
It must be noted though that the last few price candles were flashing bullish cues, with the same accompanied by spikes in trading volumes.
While the MACD line continued to move below the Signal line, well below the histogram, the Chaikin Money Flow was holding steady close to 0.20 – A sign of capital inflows still being predominant in the market.