
Bitcoin Cash’s gains were cut short at the 200% Fibonacci extension level ($819.2), but the bulls were tipped to drive the price higher over the next few sessions. SUSHI recently recaptured the $17-mark after moving north of its descending channel. Finally, Qtum was projected to hike above $17 after negotiating a minor pullback on the charts.
Bitcoin Cash [BCH]
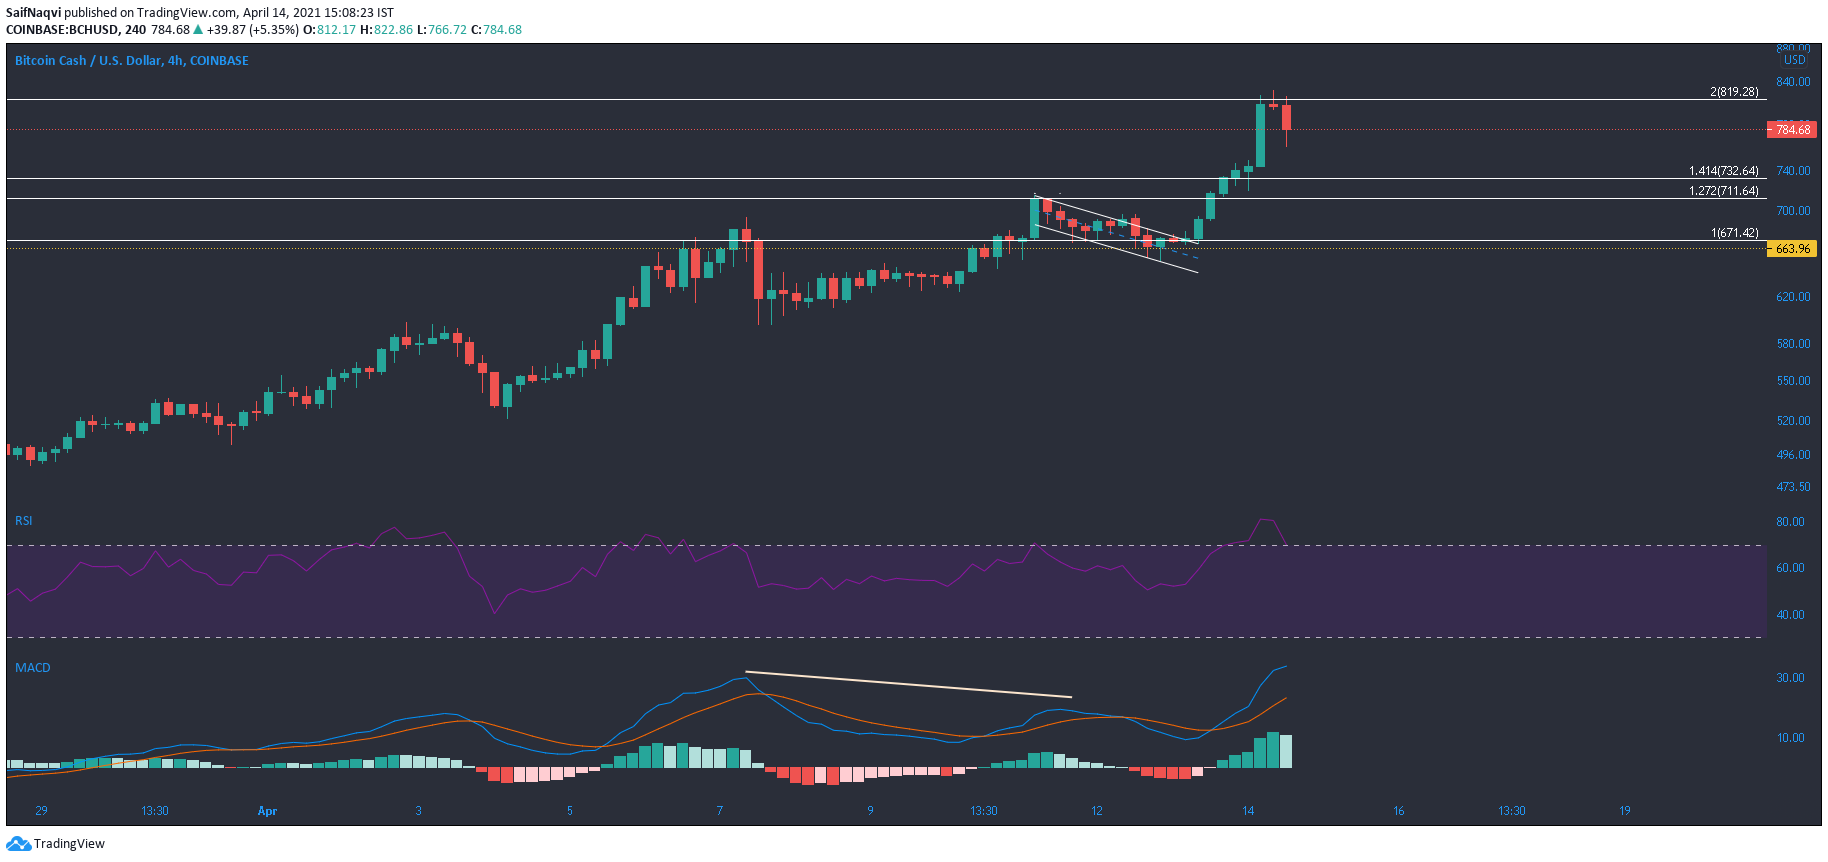
Source: BCH/USD, TradingView
Using the rally on 25 March and the retracement thereafter, some Fibonacci extension levels were highlighted on Bitcoin Cash’s 4-hour chart. A descending channel appeared after a bearish divergence was spotted on the MACD. A breakout from this pattern above the $663.96 support pushed the price towards its 200% Fibonacci extension level at $819.2.
However, a reversal took place at this point and BCH was moving south, at the time of writing.
The MACD pictured a bearish crossover on the hourly timeframe (not shown), while the 4-hour timeframe showed weakening momentum. Immediate areas of support rested at the 141.4% and 127.2% extension levels, but a bounceback could take place at the psychological level of $800 as well. The RSI reversed direction from the overbought zone, but it can be expected to remain above 50 considering bullish conditions in the market.
SushiSwap [SUSHI]
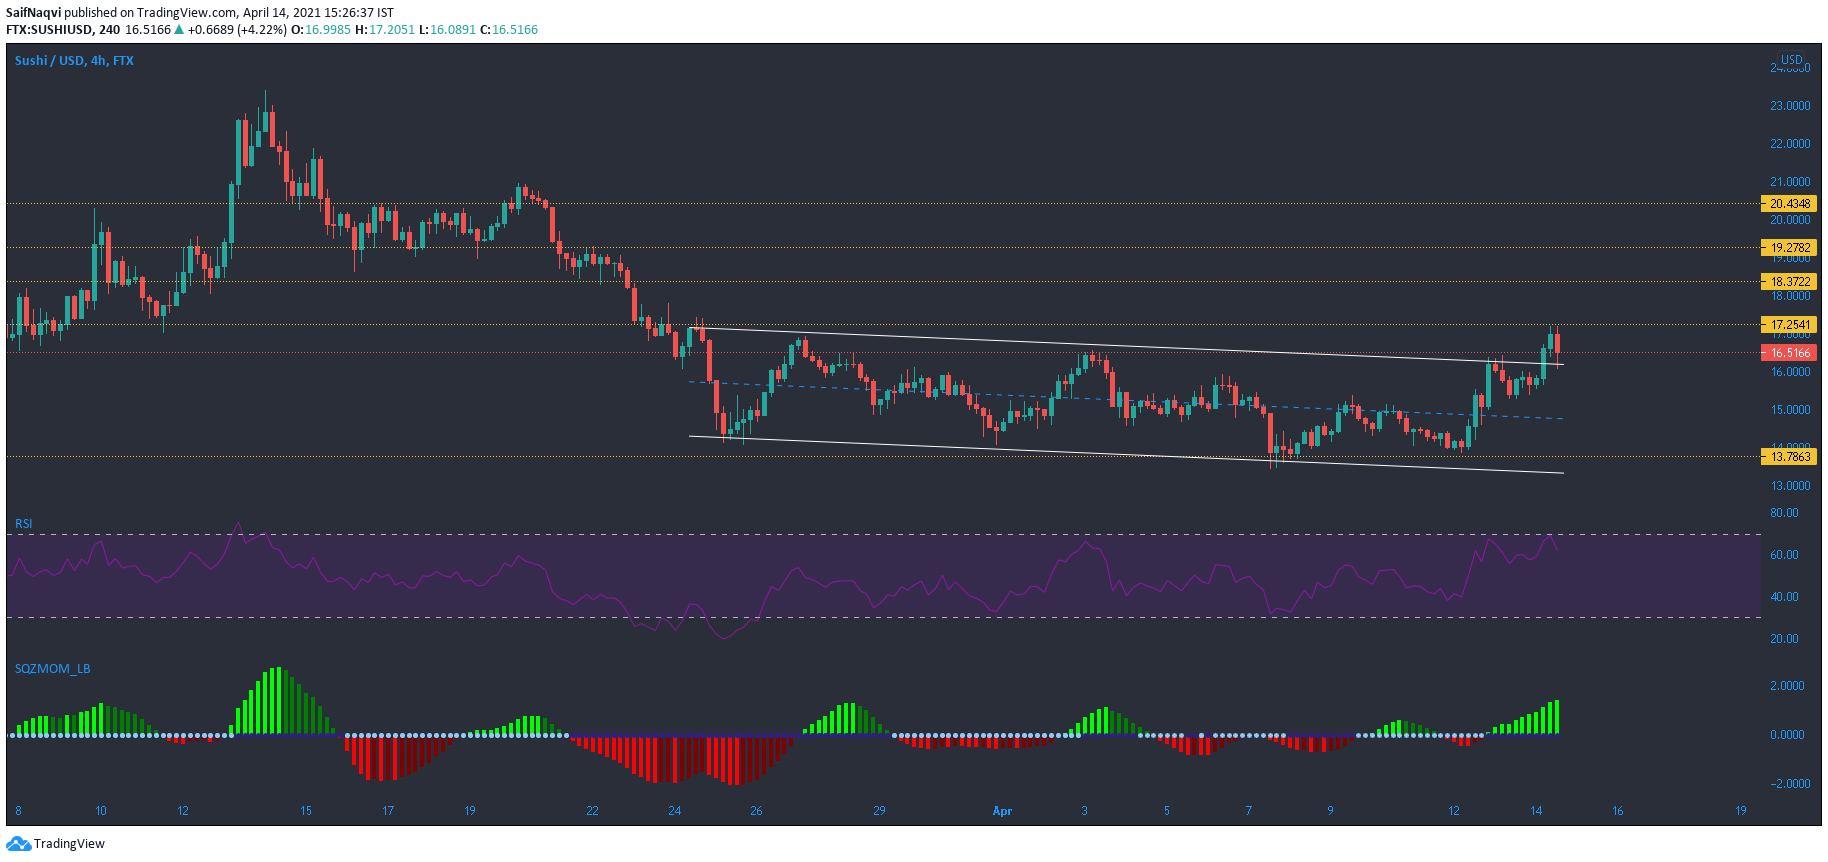
Source: SUSHI/USD, TradingView
A downwards sloping channel was seen on SushiSwap’s 4-hour chart as the price descended slowly from the $17 -mark. A breakout did take place from the pattern and SUSHI recaptured the $17-level once again. The squeeze momentum indicator highlighted the buildup of momentum towards the bullish side in a volatile market.
However, the 24-hour trading volumes took a breather and the RSI moved south from the overbought zone. This suggested that SUSHI could stabilize before noting a sharp upswing. The mid-long term prediction was still bullish and a rally over this period could see SUSHI regain the $20-mark.
Qtum [QTUM]

Source: QTUM/USD, TradingView
Qtum moved north from its upper trendline of a descending channel and peaked slightly above $17. There was some resistance at the aforementioned level, but the bulls were favored to topple this over the coming sessions.
The Awesome Oscillator formed a bearish twin peak and momentum shifted sides as QTUM retraced after touching the $18-level. Momentum once again changed hands as the price bounced back from the $14.2-support.
The indicator even moved above the half-line and additional green bars could signal an incoming price swing which could rise north of $18. The Stochastic RSI formed higher highs and indicated a bullish divergence. Even though the Stochastic RSI moved in an area of reversal, a pullback could be swiftly countered by the bullish side.