Bitcoin Cash, Synthetix, Ontology Price Analysis: 20 January

Bitcoin Cash eyed a move towards the $469.4-support level as the price moved south from its 20-SMA and 50-SMA. SNX registered a correction after the price fell by over 9% following its all-time high. Finally, ONT moved south from an ascending parallel channel and targeted the $0.591-support level.
Bitcoin Cash [BCH]
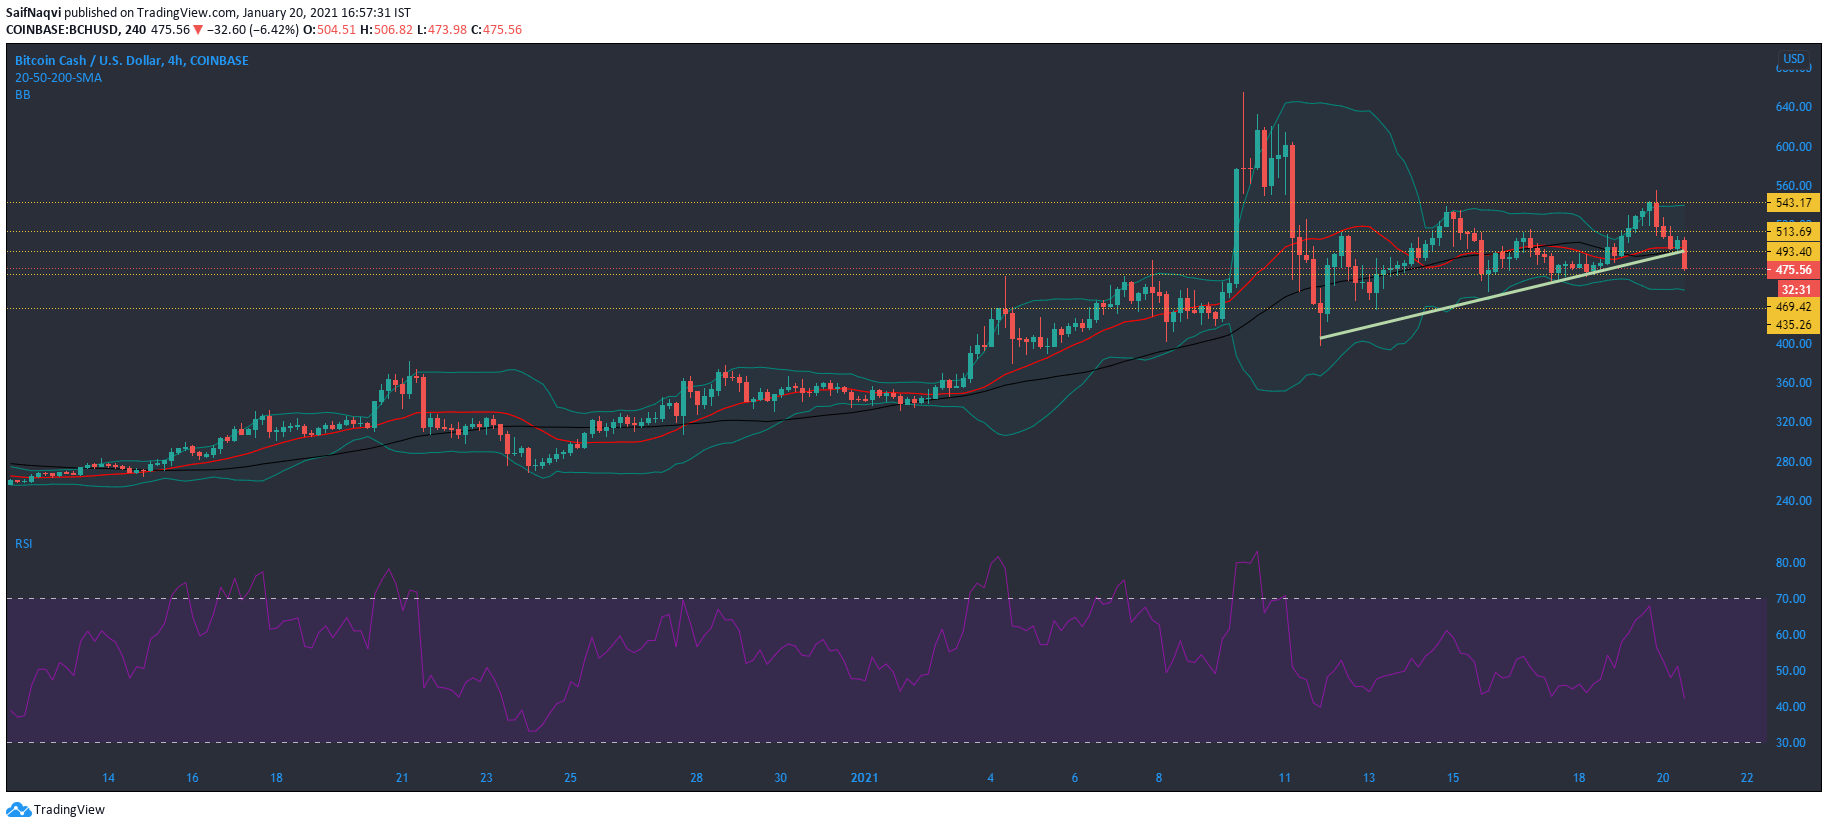
Bitcoin Cash seemed bearish, at the time of writing, as the price traded at $479.5, down by nearly 9% in the past 24 hours. A look at its chart also showed that the price fell below the 20-SMA and 50-SMA, with the finding highlighting the likelihood of a bearish trend. On the other hand, a bullish scenario could see the price bounce back from the $493.40-support and move towards the $543.17-resistance level.
The Relative Strength Index fell sharply towards the neutral zone. If the index continues to head towards the oversold zone over the next few sessions, the price could test the support at $469.42.
The Bollinger Bands showed that the price moved lower after trading on the upper band. A move towards the lower band could confirm a bearish pullback in price.
Synthetix [SNX]
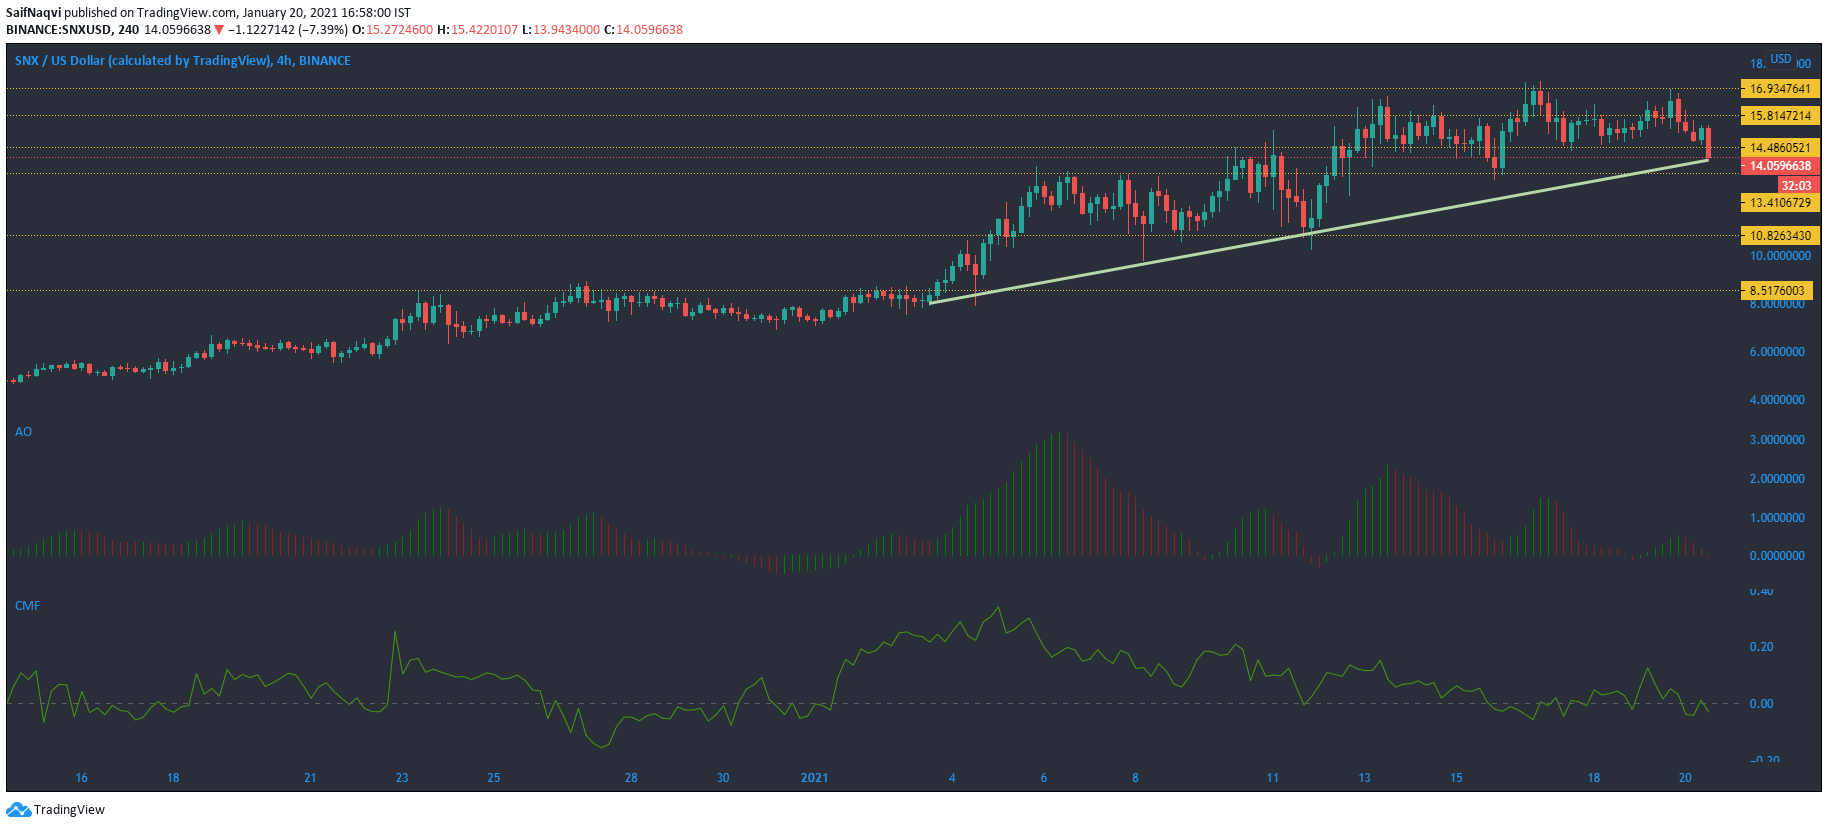
Synthetix fell below the $14.48-support level after the price dropped by over 9% in the last 24 hours. The decline came in as the sellers were dumping the crypto-asset after it scaled to record levels, signaling a potential end to the bullish cycle. SNX could find itself in a bearish trend in the near future if the price fails to hold above its press time support level.
The indicators flashed bearish signals at press time, as highlighted by the Awesome Oscillator’s red bars.
Finally, the Chaikin Money Flow suggested that capital was flowing away from the cryptocurrency. A southbound move on the charts could see SNX challenge the support level at $13.41.
Ontology [ONT]
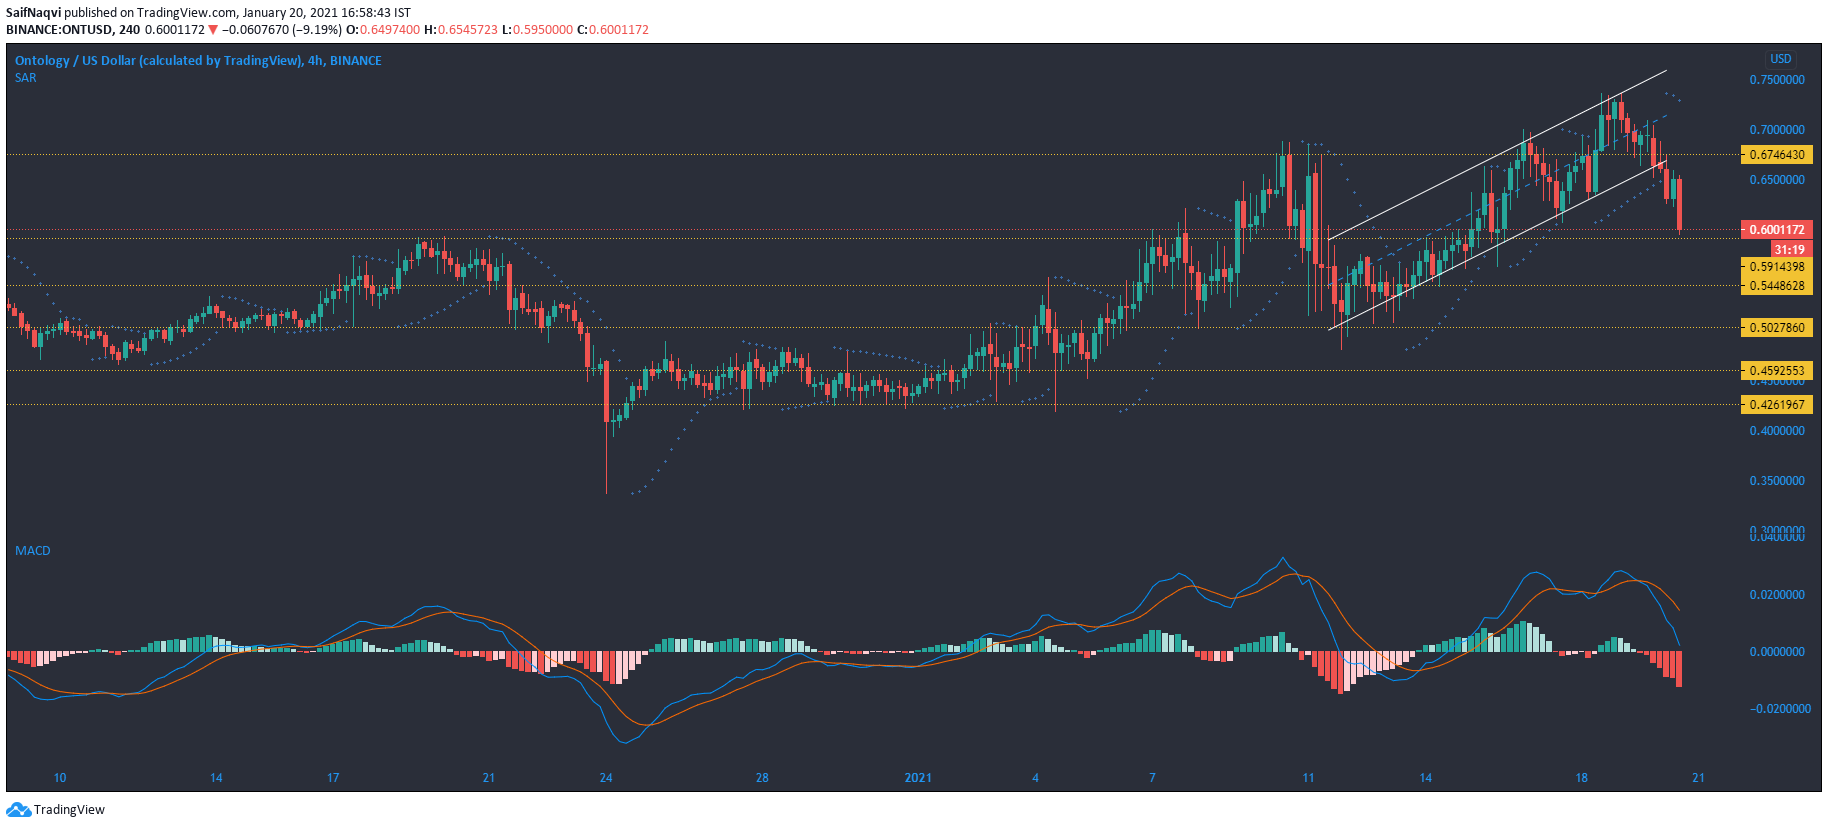
Ontology flashed red during press time and traded at $0.62, down by nearly 10% since yesterday. A downwards breakout from the parallel channel was witnessed on its 4-hr chart as the price moved lower from the pattern. The losses could be cushioned at the $0.591-support level in case the price continues to move south.
The MACD favored the sellers and showed that bearishness was on the up.
The Parabolic SAR’s dotted markers moved above the candlesticks and confirmed the downtrend for ONT.
On the flip side, a bullish outcome could see the price retest the bottom trend line and move back within the pattern.


