Bitcoin Cash, Tron, Elrond Price Analysis: 04 March

Bitcoin Cash was trading just above a level of support at $507 as bearish momentum took sway. Tron and Elrond appeared to regain some bullish momentum though as while Tron climbed past $0.05, EGLD broke out of its descending channel pattern over the past few days.
Bitcoin Cash [BCH]
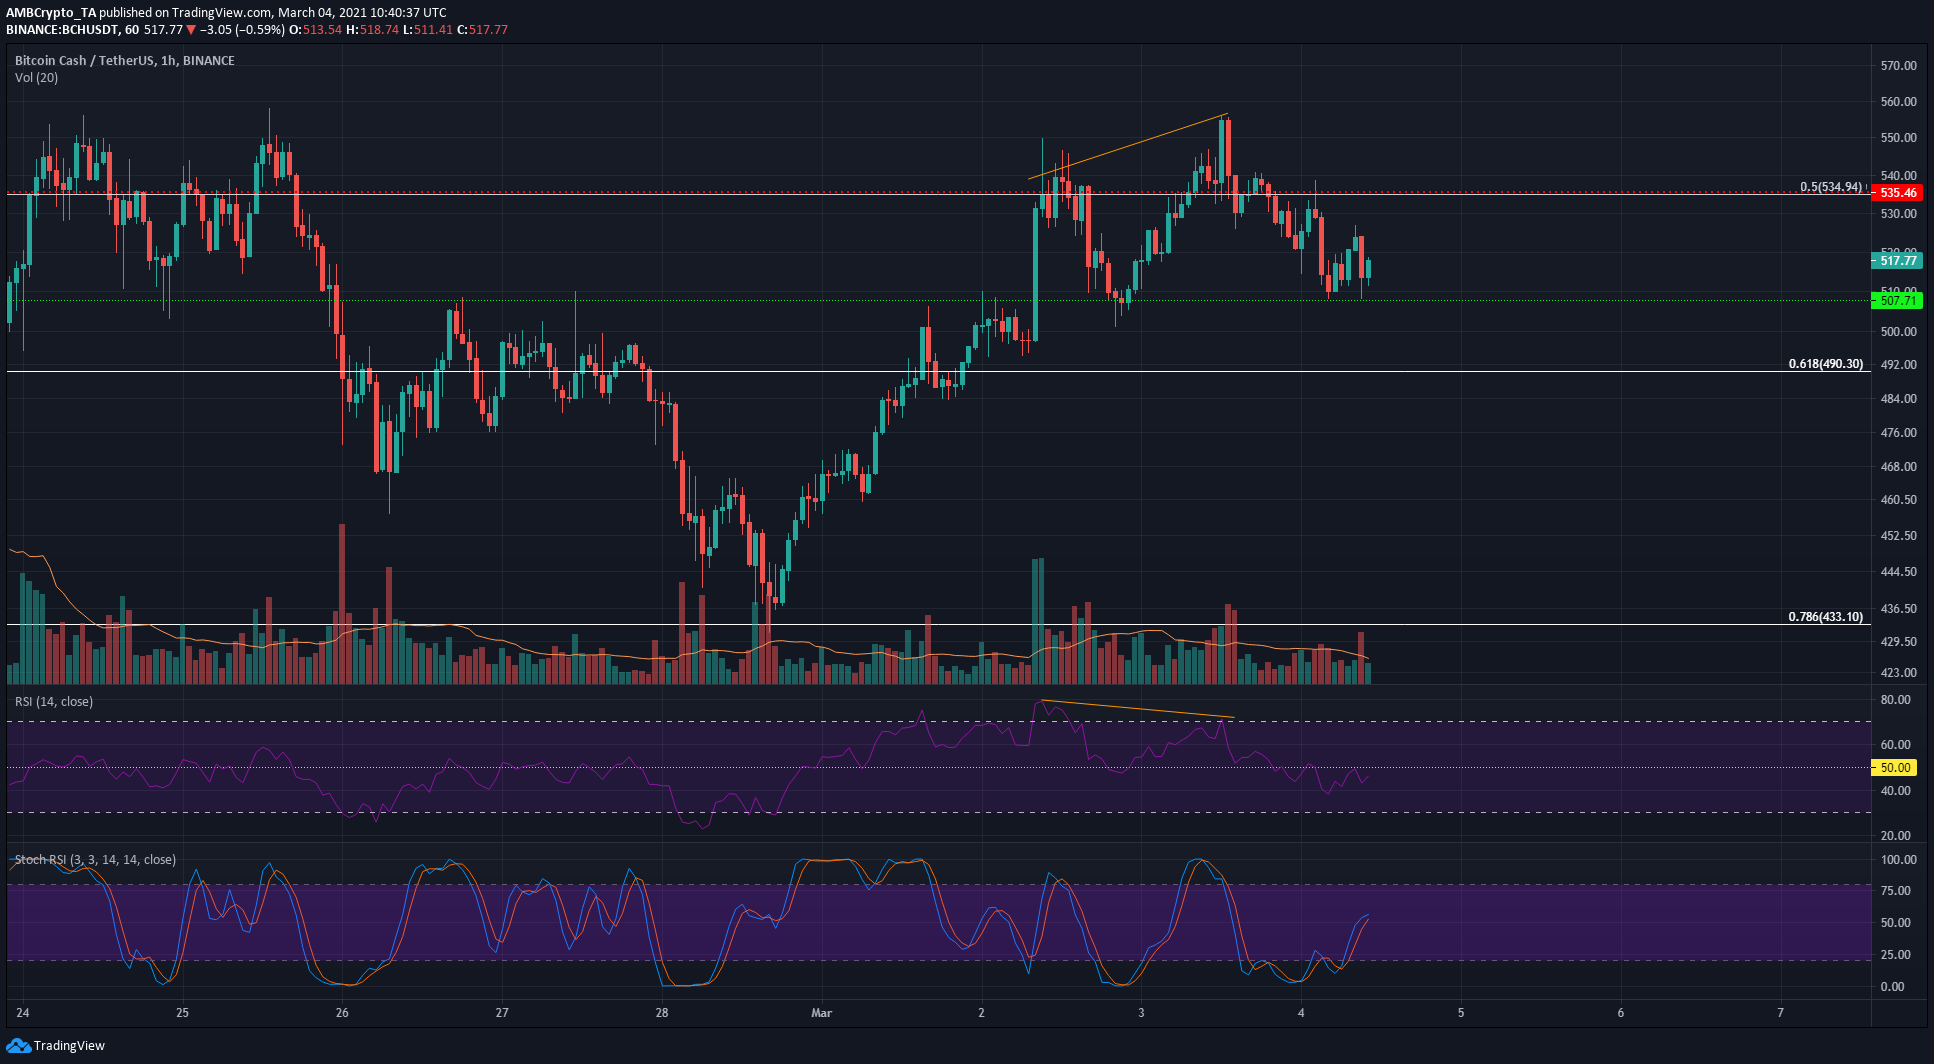
BCH noted a bearish divergence on the charts, with the price making higher highs even as the momentum indicator (RSI) made lower highs. This, coupled with Bitcoin’s slide from $52,000, saw BCH drop from $550 to touch $508 over the past few days.
Subsequently, Bitcoin Cash bounced to $523, but the short-term momentum was in favor of the bears as the RSI slipped under 50 to denote a hike in bearish pressure. The $507-level has acted as support previously, but it is likely to be flipped to resistance over the next few hours.
Trading volume spiked during sessions where BCH lost value, suggesting that market sentiment was in favor of the market’s bears.
Tron [TRX]
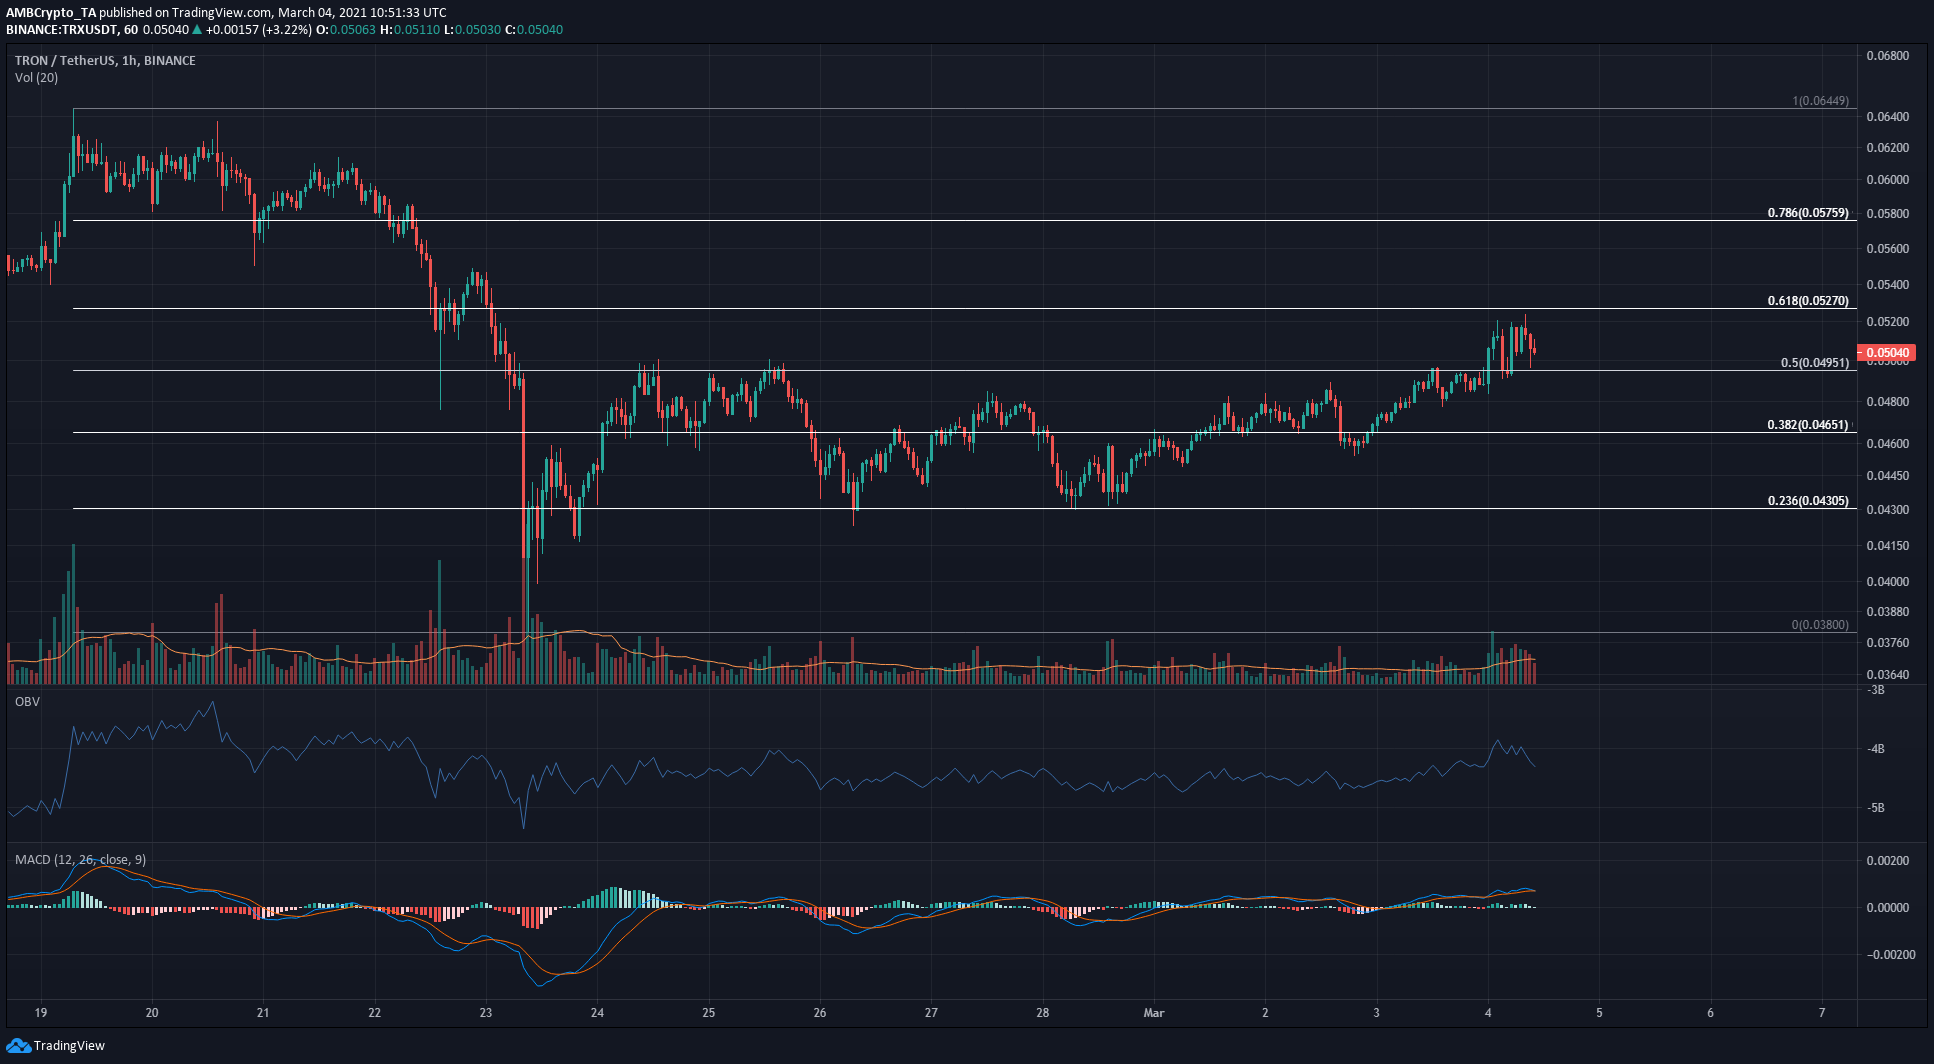
The past few days have seen TRX climb past the 38.2% and the 50% retracement levels, based on TRX’s fall from $0.06 to $0.038. The OBV also climbed slowly and registered a series of higher lows, but this was not yet indicative of bullish strength.
The MACD registered a slight uptick in northbound momentum. In conjunction with TRX’s climb past the $0.05-mark, it seemed to be a sign of steady recovery for TRX. A drop back under the $0.0495-mark would be a bearish development and could result in the market’s bears flipping the retracement level from support to resistance.
Elrond [EGLD]
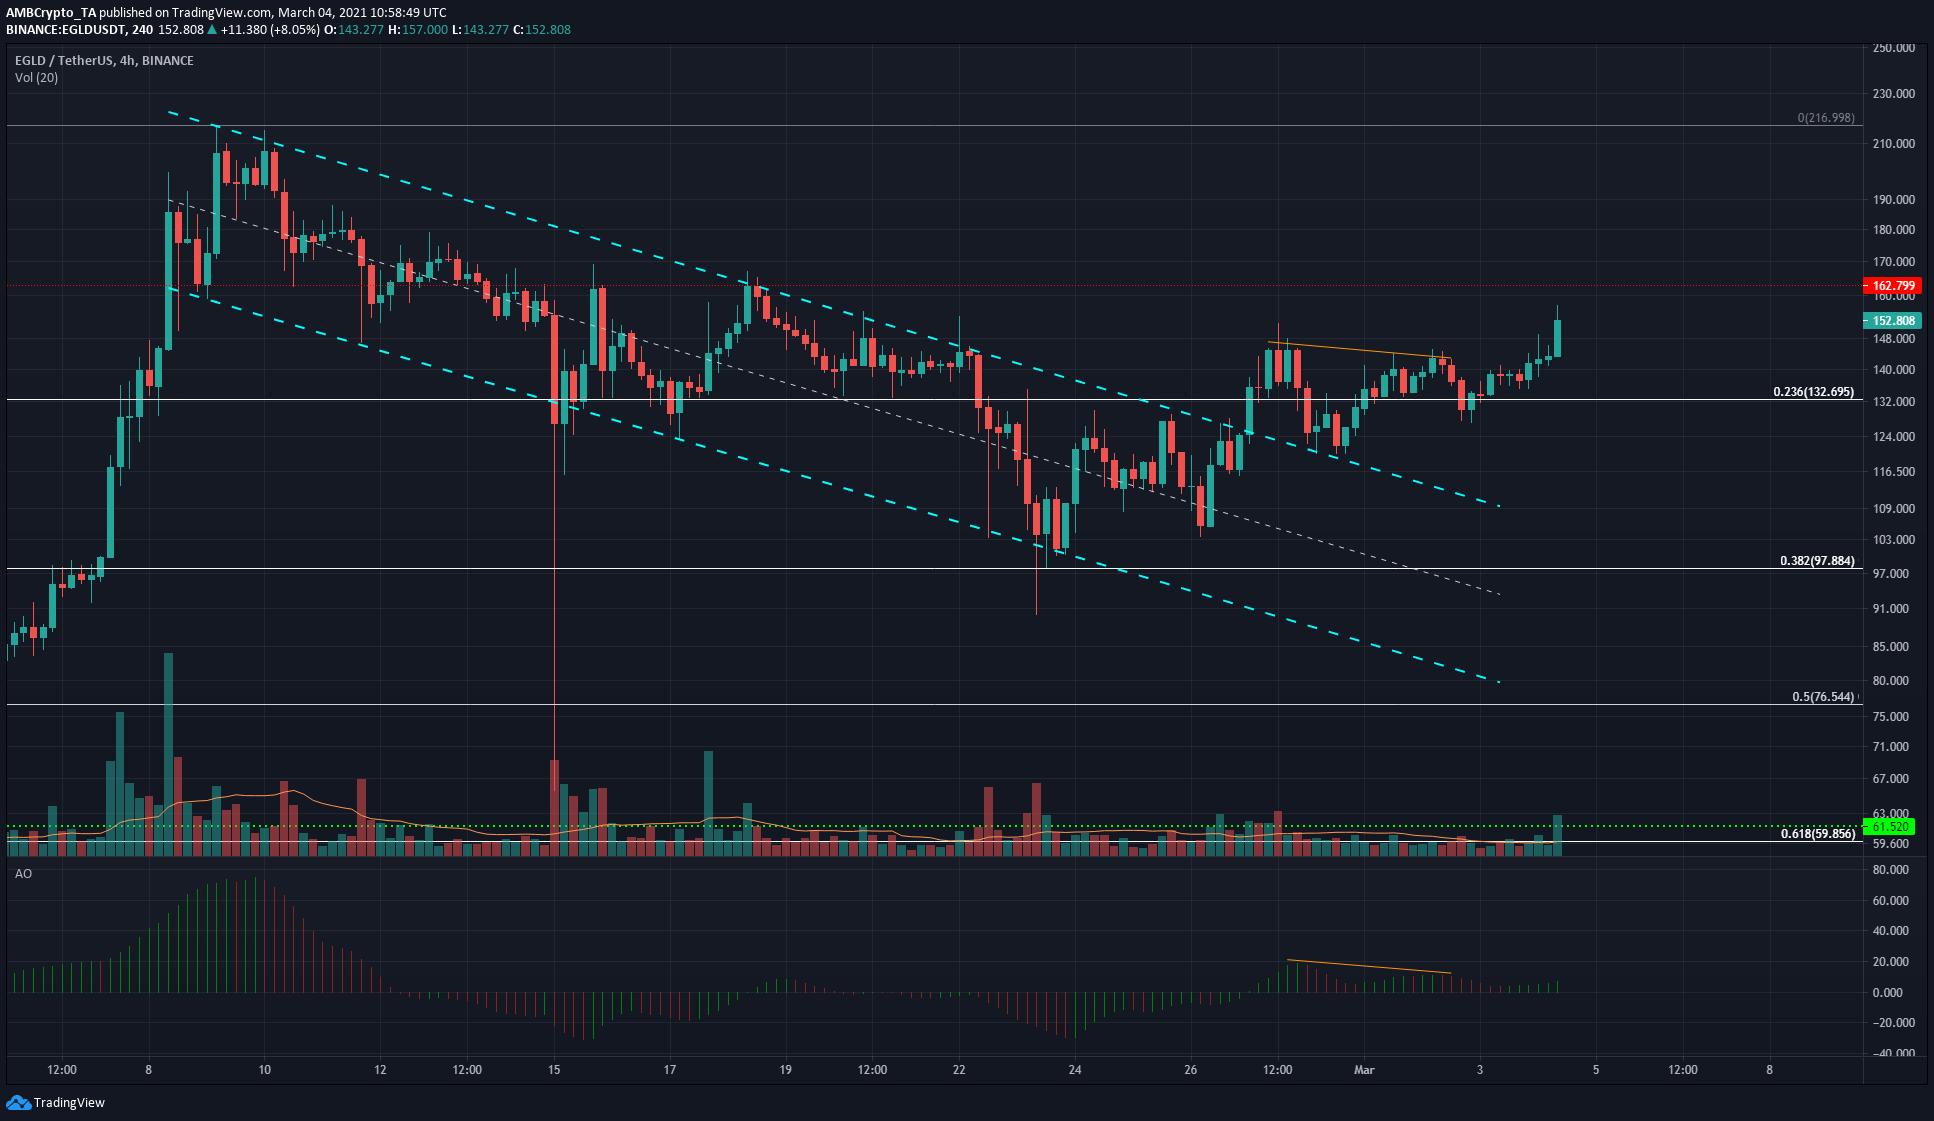
On the 4-hour chart, EGLD broke out to the upside and retested the upper boundaries of the descending channel it was trading within for most of February. Such a breakout generally sees the price reverse and rise back towards the peak of the channel – In this instance, to the $200-$210 region.
After the price flipped the 23.6% retracement level to support, there was a noticeable hike in trading volume. Even though the most recent session hadn’t closed at press time, it had significant volume and pointed to market conviction.
The Awesome Oscillator pictured a bearish twin peak set up (orange), a sell signal, but EGLD bulls were able to arrest the fall at $130 and drive the prices higher.