Bitcoin, Dogecoin, MATIC Price Analysis: 11 November

After a bullish rally, Bitcoin crossed the $69,000-mark to touch its ATH on 10 November. Now, with the correction phase kicking in, the near-term technical indicators for Bitcoin and the majority of altcoins flashed red signs.
Dogecoin and MATIC were no exceptions, as their near-term indicators pointed at increasing bearish influence.
Bitcoin (BTC)
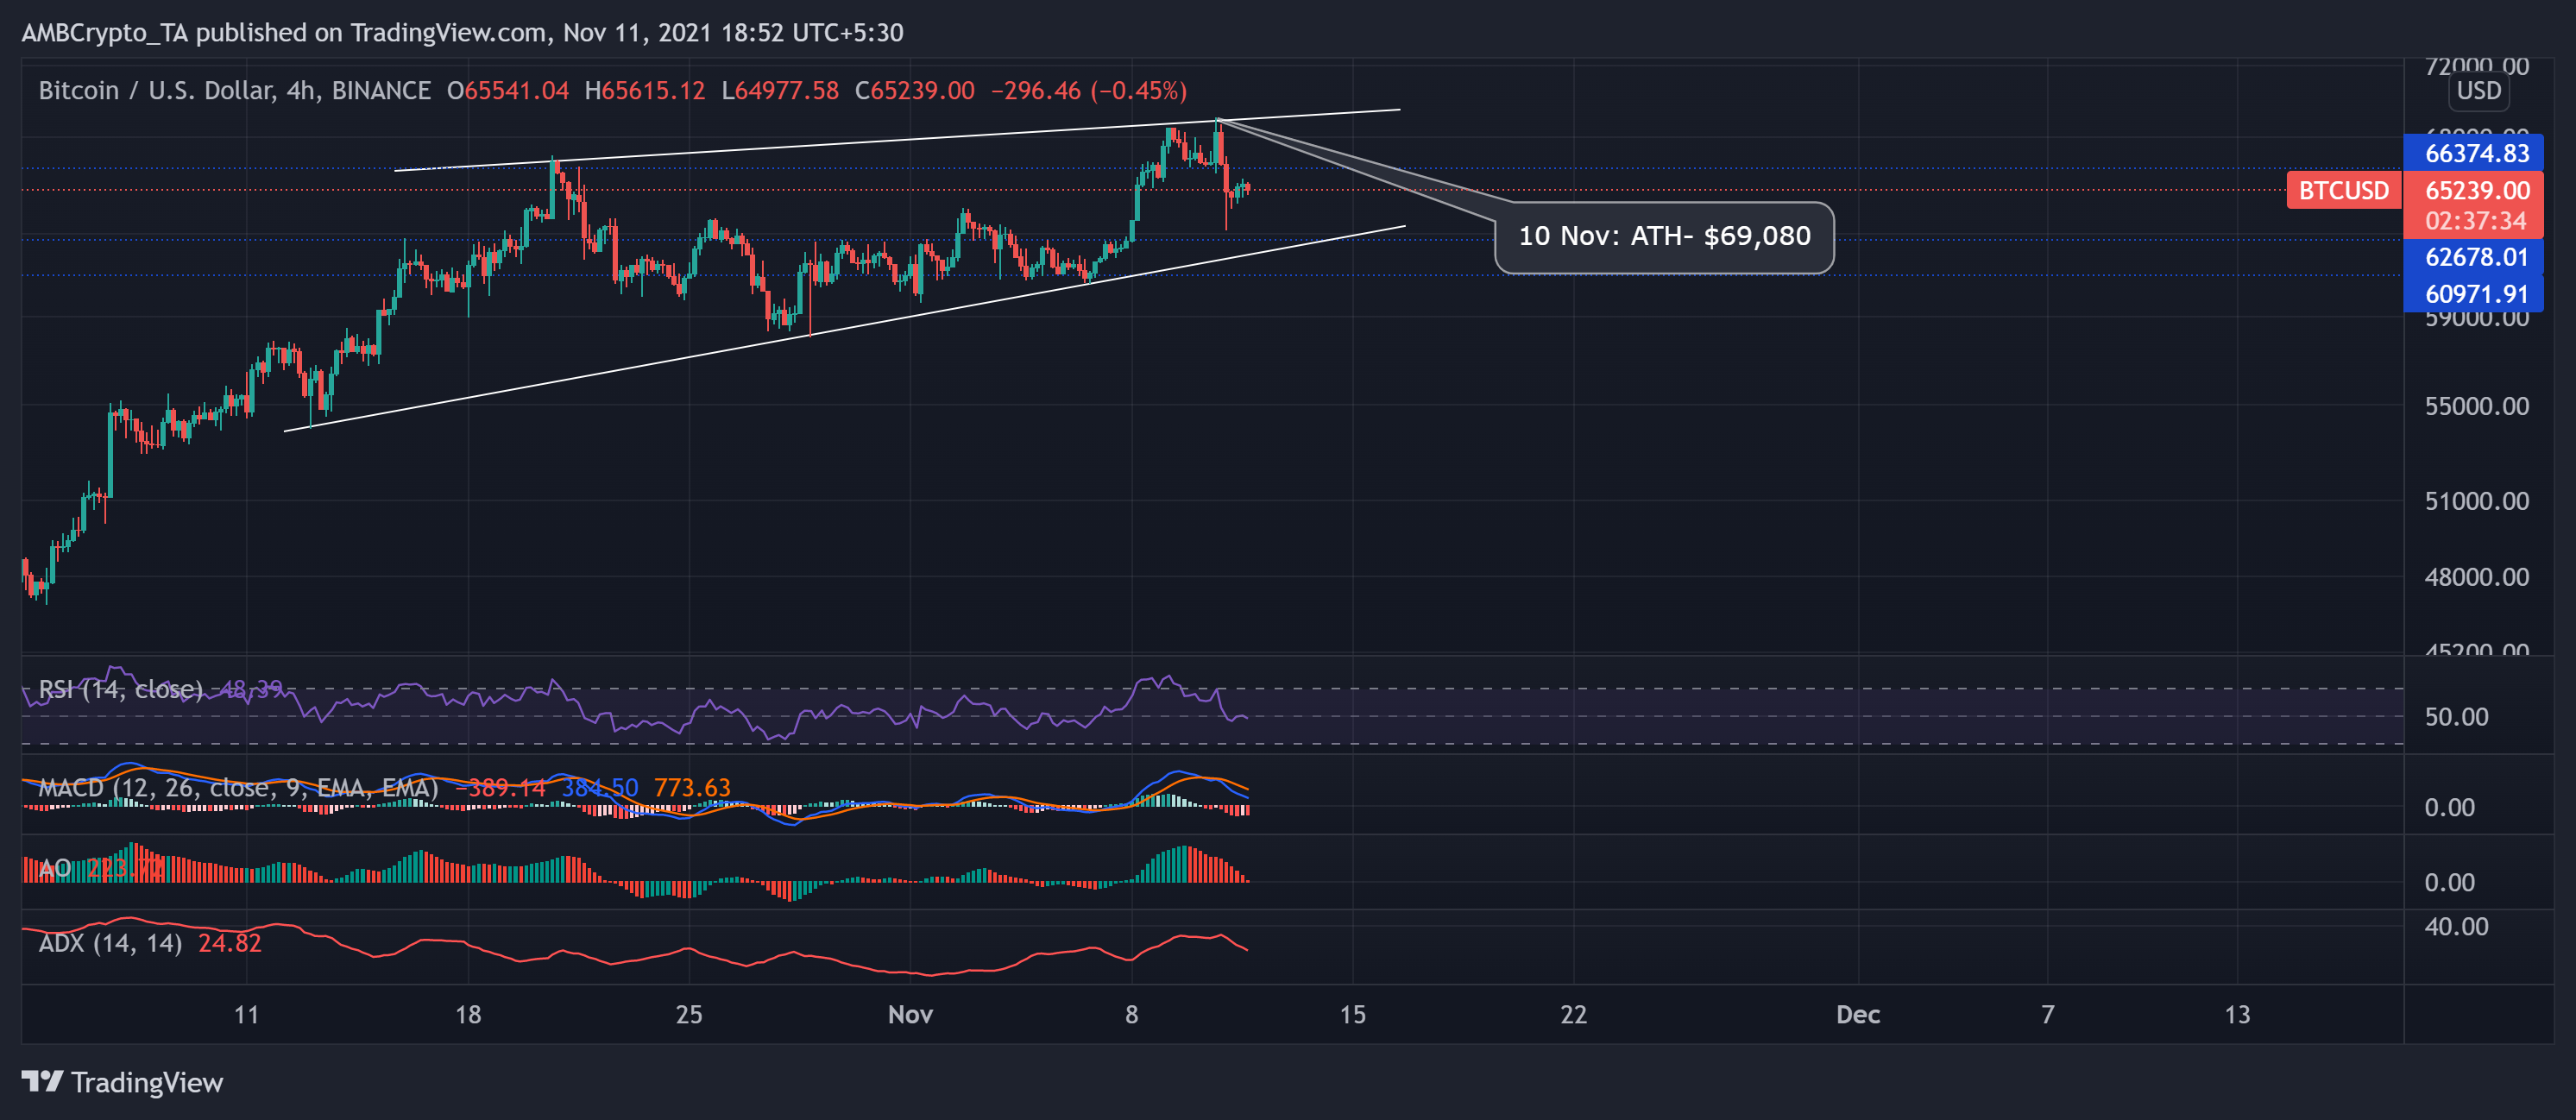
Bitcoin enjoyed a sustained rally over the past three months and recorded a nearly 50% ROI over that period. Since 13 October, the price action ascended in a rising wedge and registered an approximately 17% monthly growth. BTC bulls vigorously countered the bears and displayed dominance as the price hits its ATH on 10 November at $69,080.
In the last 24 hours, the bears showed resistance at the upper trendline as the price witnessed a pullback. On the other hand, the bulls have found support in the $62,000 region. Over the past day, Bitcoin dealt with a near-term correction soon after the RSI hit the overbought level. Consequently, BTC traded at $65,239 after noting a 4.2% loss since yesterday.
The near-term technicals reiterated the increasing selling influence. The Relative Strength Index (RSI) was below the midline and pointed downwards. Also, the MACD and Awesome Oscillator (AO) correlated with RSI analysis. Nevertheless, the Average Directional Index (ADX) was southbound after displaying a slightly weak directional trend.
Dogecoin (DOGE)
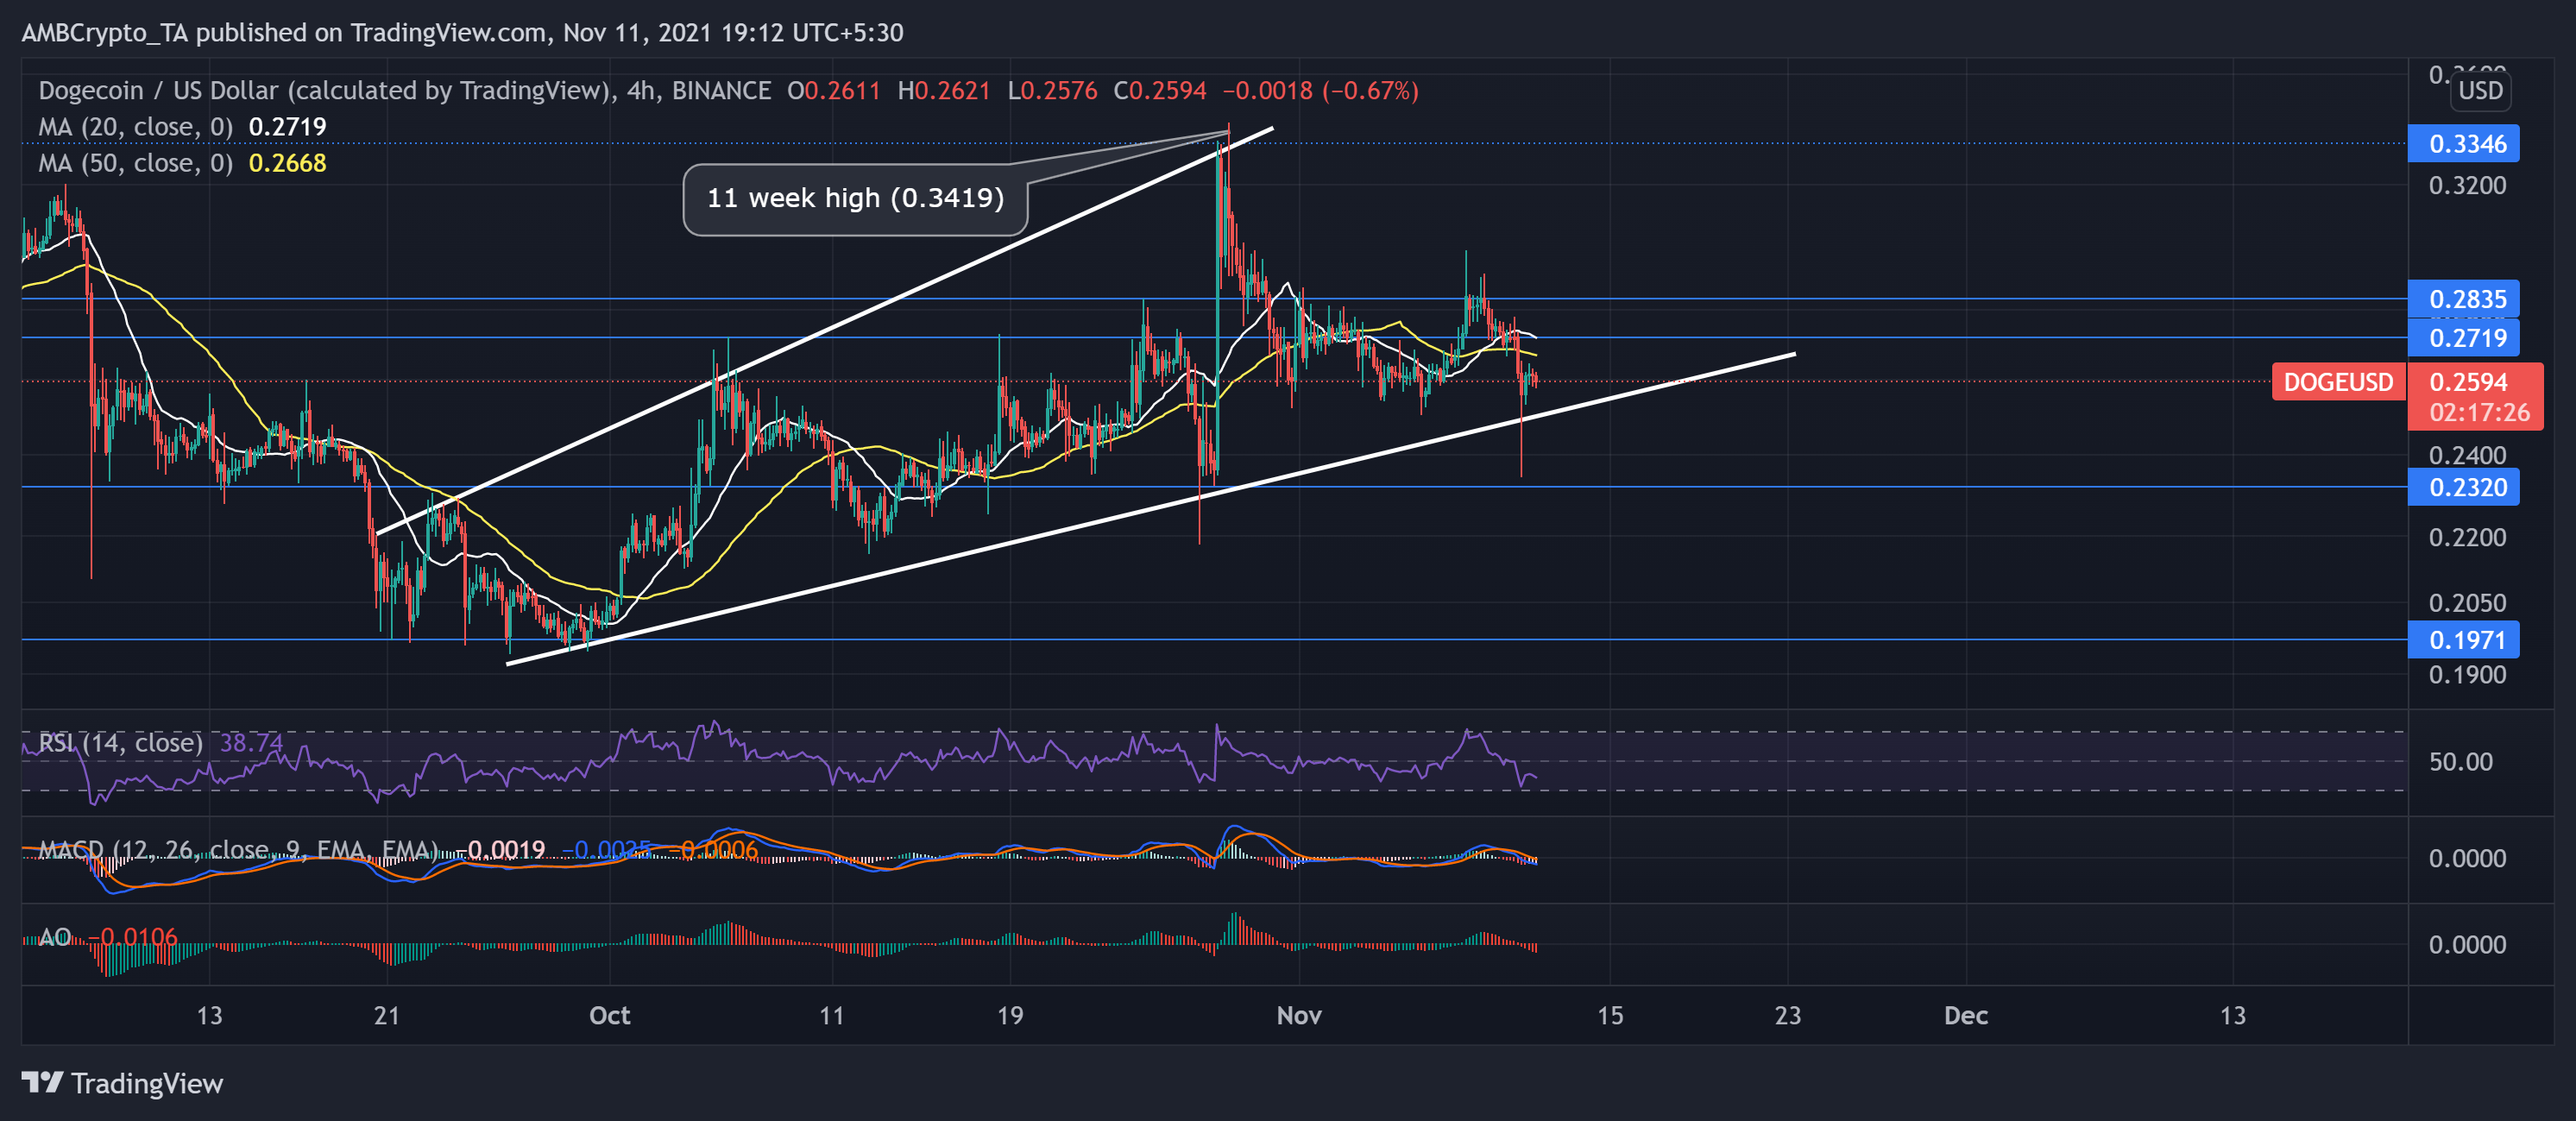
DOGE oscillated within a rising wedge since 26 September. The meme coin noted over 15% monthly ROI. As a result, the alt touched its 11-week high on 28 October and then witnessed a pullback. Consequently, it bounced back from the upper trendline and found support at $0.2320.
DOGE saw a 4.66% decline in 24 hours as near-term technicals depicted increasing selling pressure. At press time, DOGE traded at $0.2594 and registered over a 3.4% weekly loss.
The price traded below its 4-hour 20 (white) and 50 (yellow) SMA, visibly preferring the selling momentum in the near term. Additionally, the RSI was southbound at the 39-mark. Also, the AO and MACD exhibited an inclination for the sellers. DOGE bulls will undeniably need to increase their influence to breach the immediate resistance at $0.2719.
MATIC
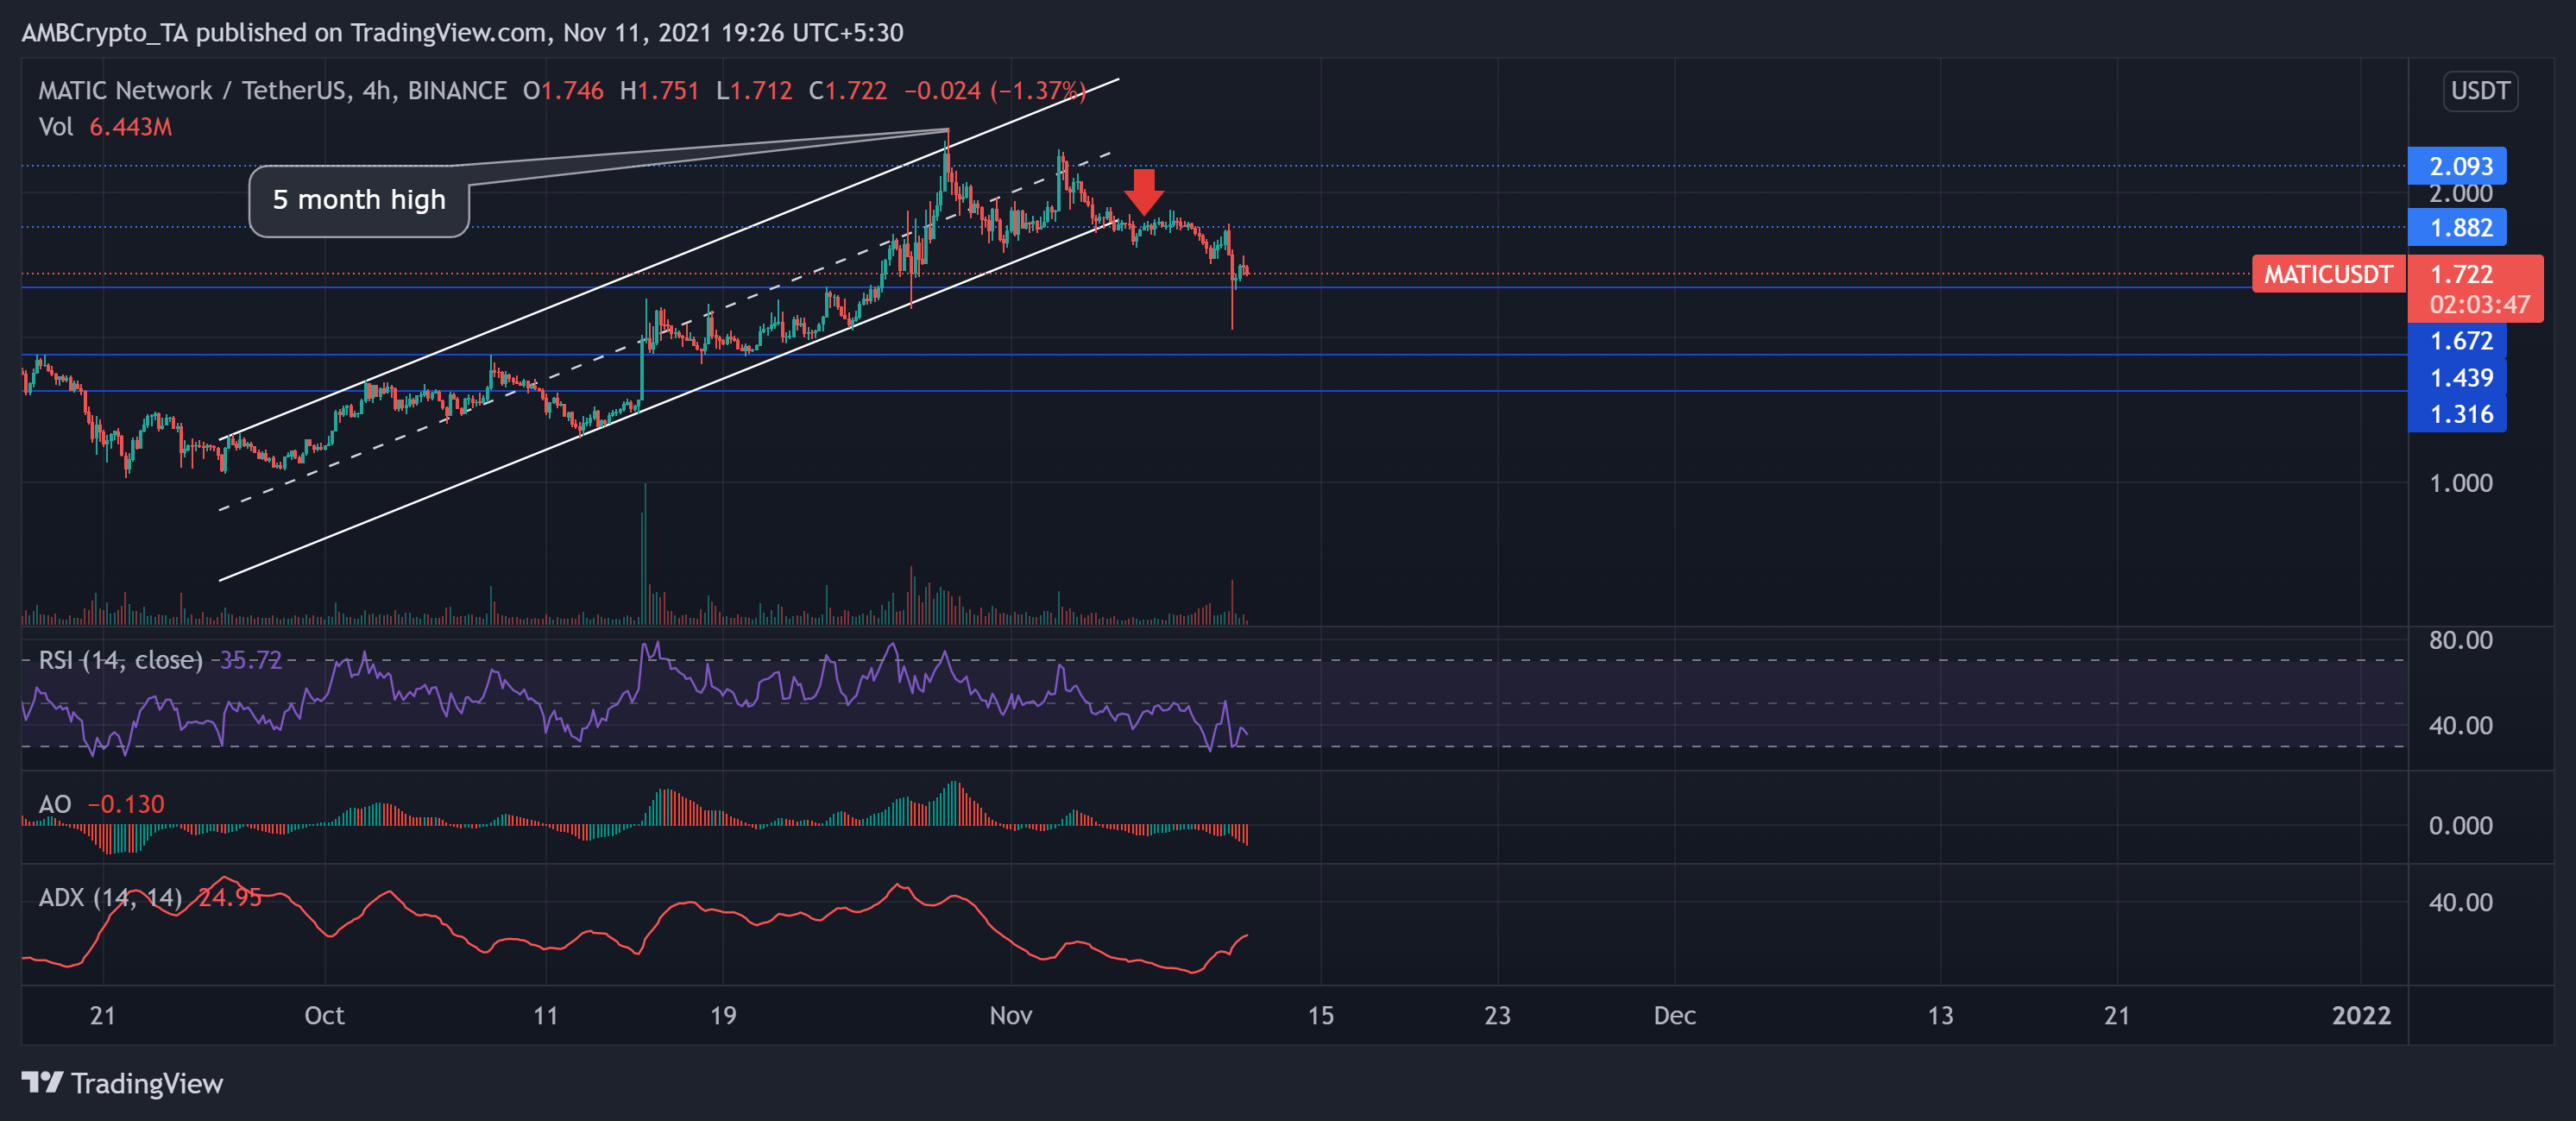
Since 26 September, MATIC price action undertook a bullish trajectory as the price bounced between the two parallel lines heading north. The altcoin noted a 41.1% monthly ROI. Consequently, MATIC reached its five-month high on 29 October and retreated between the parallel lines following the trend.
However, the altcoin saw a 6.4% decline in 24 hours and a 15.3% seven-day fall. The price action breached the lower line of the parallel channel and found support at $1.672. The near-term technicals depicted increasing selling strength. At press time, MATIC traded at $1.722.
The RSI plunged by 16 points and headed towards the oversold territory, confirming a selling preference. Moreover, the AO flashed red signs after peaking higher and corresponded with RSI. Nevertheless, the ADX displayed a slightly weak directional trend.


