Bitcoin: Don’t panic, here’s why BTC’s drop to $15,000 could act in your favor

- The $15,000 price mark could be a good price bottom for BTC
- The SOPR 30MA showed that a bottom formation might be on BTC’s horizon
A further decline to the $15,000 price range could mark the price bottom for leading coin, Bitcoin [BTC], CryptoQuant analyst Nakju opined in a report.
According to Nakju, many traders often use BTC’s Coin Days Destroyed (CDD) metric to assess the movements of long-held coins on the BTC network. These traders also interpret the same as a sell signal.
Are your BTC holdings flashing green? Check the Profit Calculator
However, Nakju opined that the CDD metric could also represent volatility rather than just be used to assess the proper time to sell. Taking a cue from the historical performance of BTC’s CDD, it has acted as a precursor to both big price plunges and significant price rises.

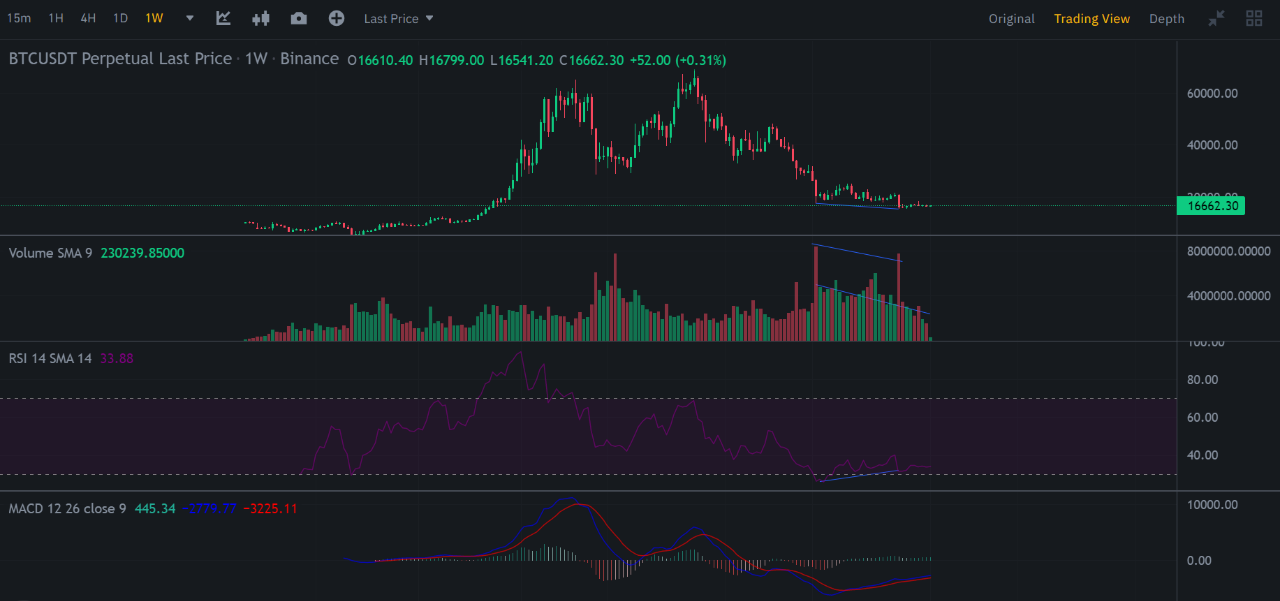
Furthermore, as per Nakju, if BTC’s price plummets to $15,000, it could play in favor of investors. He believed that the price range could be as a good example of when BTC would typically log a regular bullish divergence marked by a period of low trading volume and an oversold Relative Strength Index (RSI).
According to Nakju, trend reversals “of any asset occurs when the volume of transactions is small.” Hence, the $15,000 price mark might be a price bottom to be followed by a long-term rally in BTC’s price.
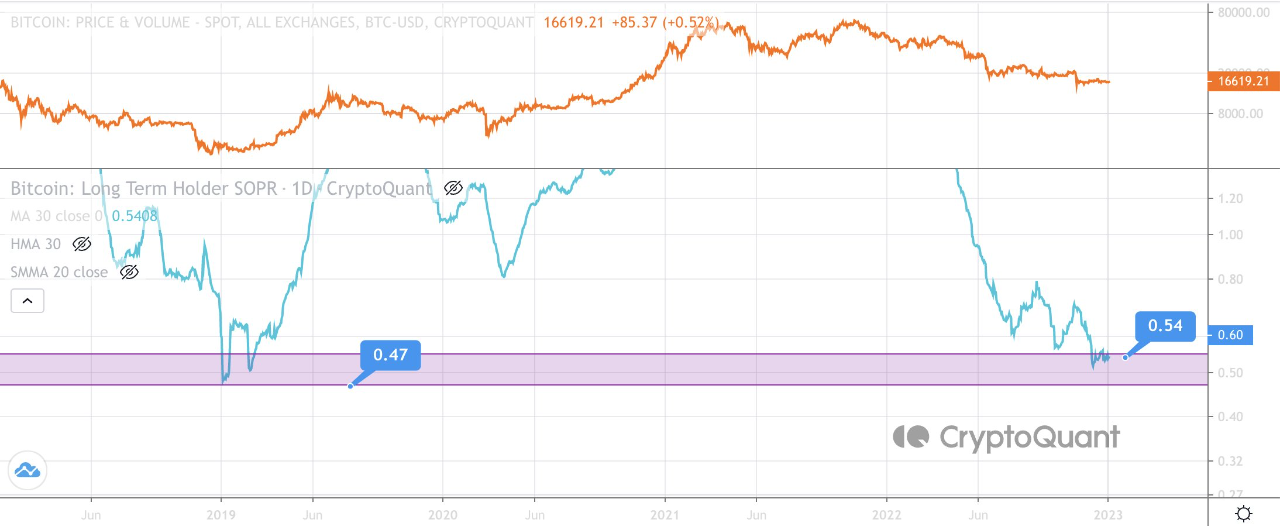
Another CryptoQuant analyst Onchain Edge, found that the current value of the king coin’s SOPR MA30 was 0.54. This was while assessing BTC’s Spent Output Profit Ratio (SOPR) on a 30-day moving average.
According to the analyst, the current SOPR level acted as a bear market bottom indicator in previous bear cycles in 2012, 2014, and 2018. Furthermore, Onchain Edge recommended using dollar cost averaging (DCA) and setting accumulation targets as BTC gears up to touch the bear market’s bottom.
He also advised BTC investors to remain bullish in 2023.
Day traders are not dilly-dallying
As of this writing, BTC traded at $16,733.07 per data from CoinMarketCap. An assessment of the king coin’s performance on a four-hour chart revealed increased accumulation by day traders.
As of this writing, the Relative Strength Index (RSI) was in an uptrend at 60.88. Similarly, the Money Flow Index (MFI) was seated above the 50-neutral mark at 68.33. This indicated increased BTC purchases by day traders.
Likewise, the dynamic line (green) of BTC’s Chaikin Money Flow (CMF) was pegged above the center line at 0.22. A CMF value above the zero line is a sign of strength in the market.

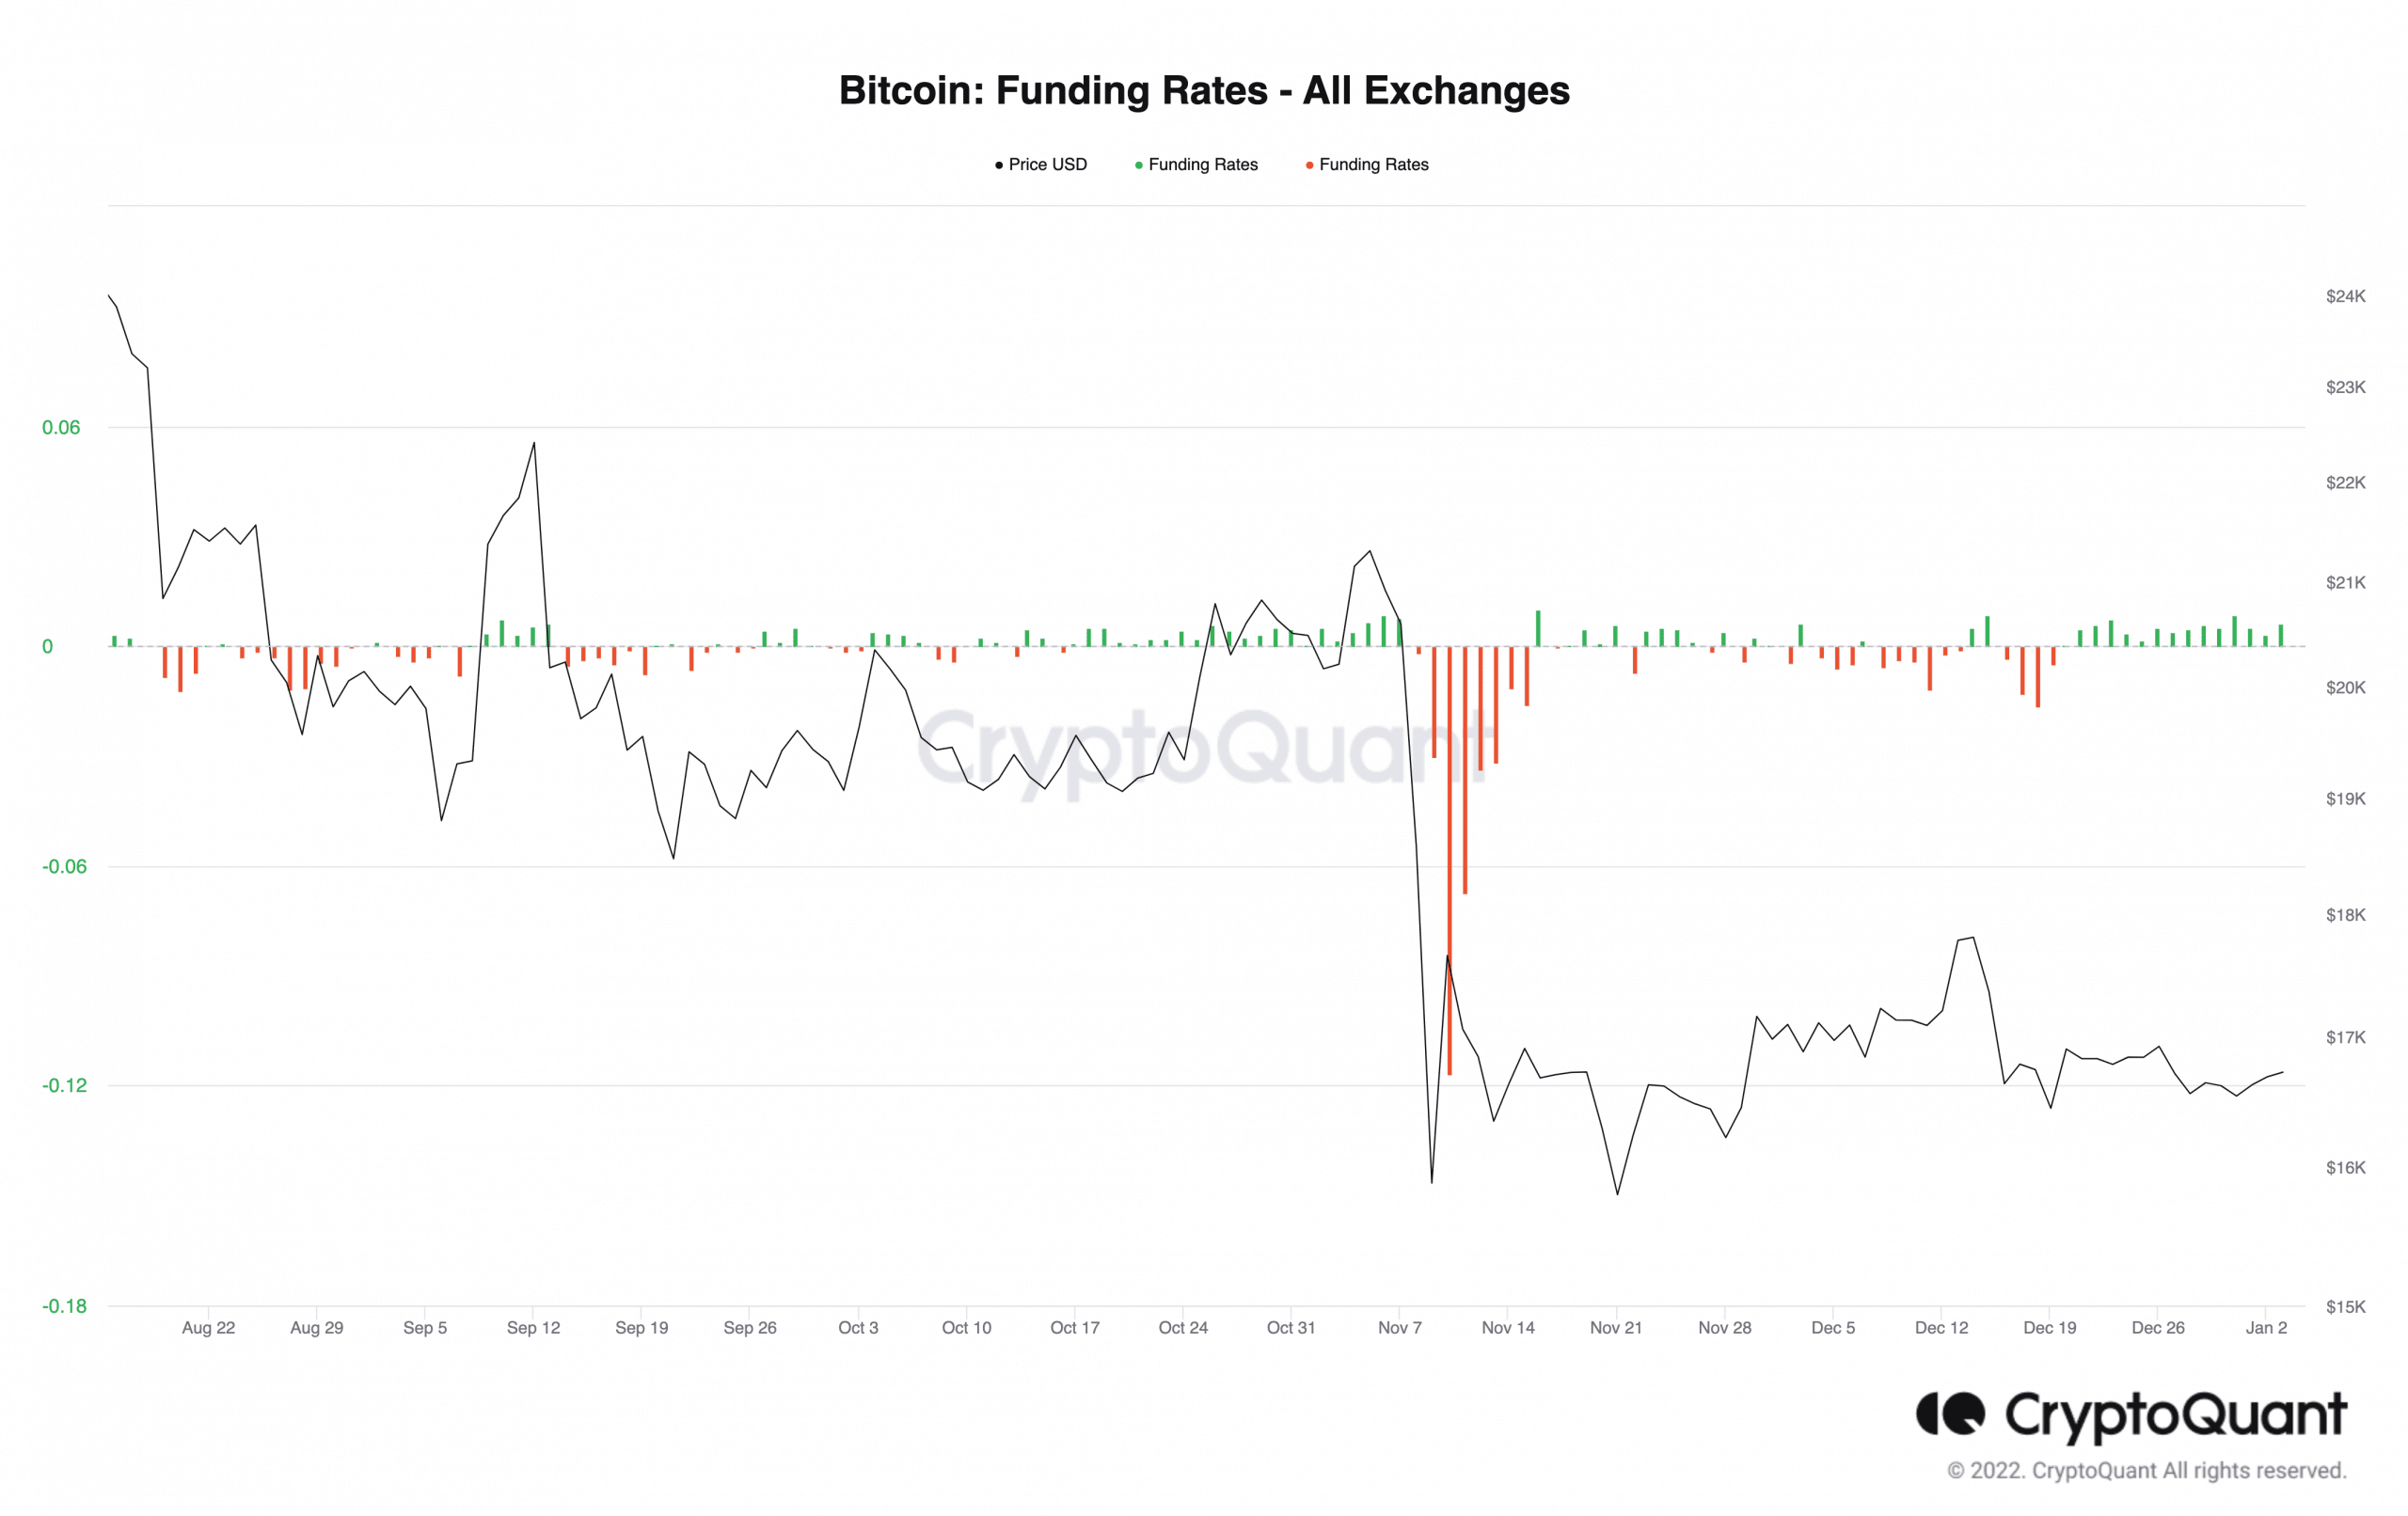
Finally, BTC’s funding rates at the time of writing were positive and have been so since 21 December 2022, data from CryptoQuant revealed. This meant that long-position traders have since dominated the market, betting in favor of an upward rally in BTC’s price.