Bitcoin: Gauging what the market top is as the rally weakens

BTC has dipped by close to 10% over the last 24 hours, dropping below $60k for the first time in three weeks. This Bitcoin-led market crash pulled down the global cryptocurrency market cap to $2.55 trillion, down by over 10% in just a few days.
While this move has affected Bitcoin’s charts and led to several signs of “weak hand” sell-offs, a curious and opposing social sentiment has taken over market participants.
On one hand, social sentiment seems largely bullish as ‘buy the dip’ chants took over Twitter. On the other hand, many analysts presented the bearish possibility of $69k being the market top.
So, was $69k the BTC top?
Even though the crypto’s trajectory, of late, has sent tremors down the market, whether $69k is in fact the market top remains uncertain. On the bright side, however, there seemed to be clear signs that the market hadn’t reached its potential yet based on BTC’s historical behavior and cyclical patterns that signaled market tops in the past.
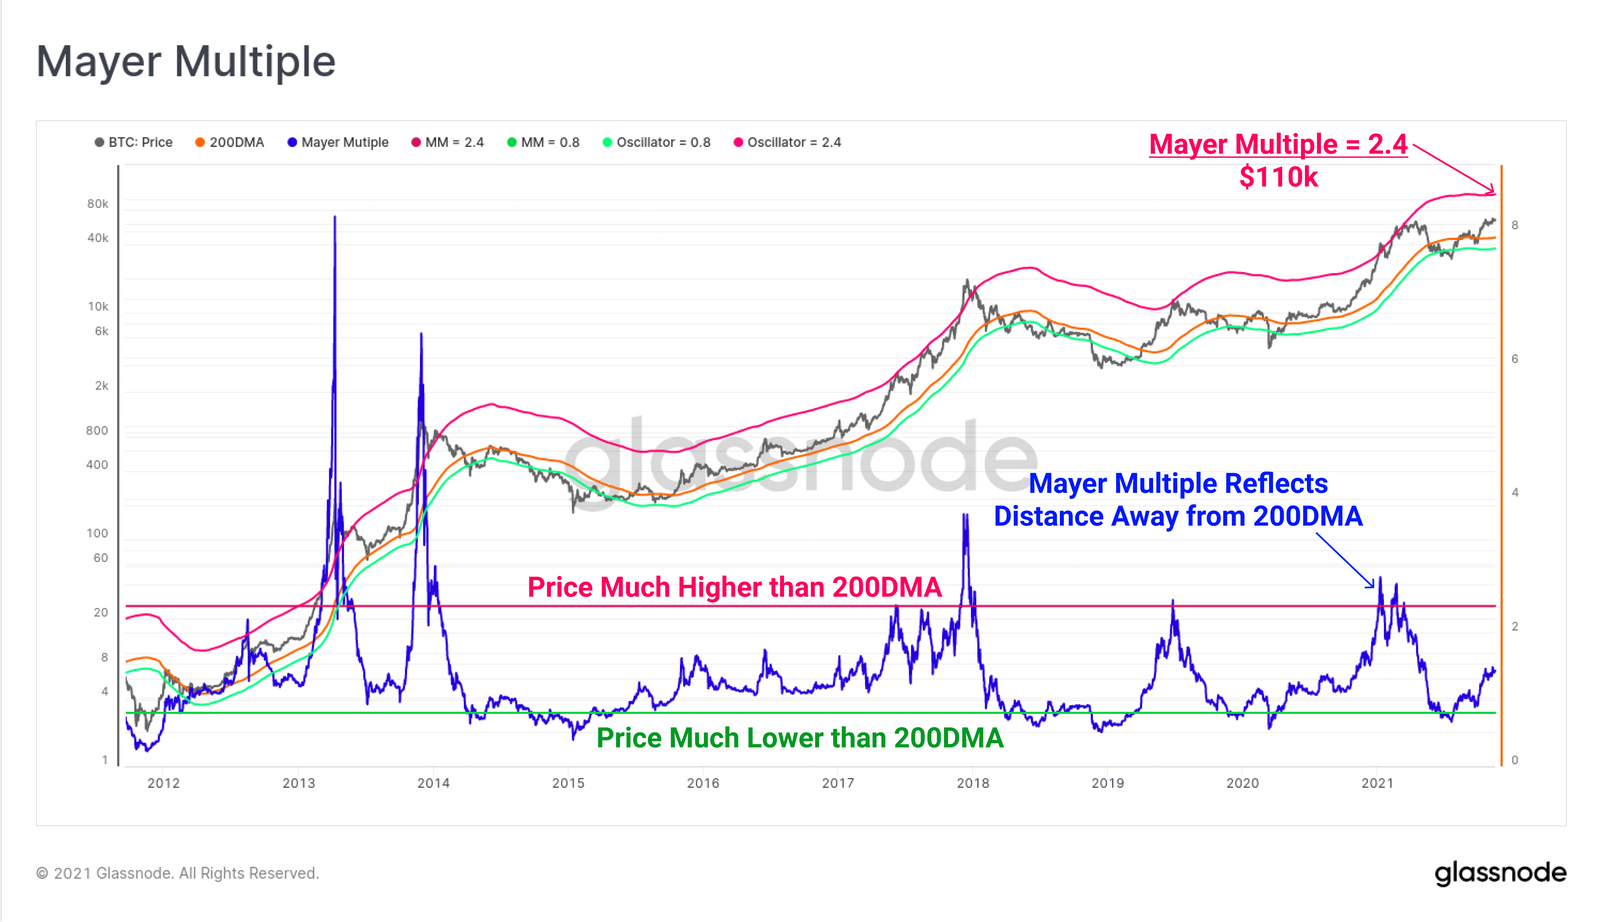
Mayer Multiple calculates the ratio between the price and the 200DMA and is an effective indicator to assess market tops. It noted a value of 2.4 at press time, reflecting an unlikely extreme, one where the price has rallied to 2.4x over the long-term and well-observed by the 200DMA.
This provides an upper pricing band, currently sitting at $110k according to Glassnode. That being said, it could trend higher or lower as the 200DMA price changes.

Source: Glassnode
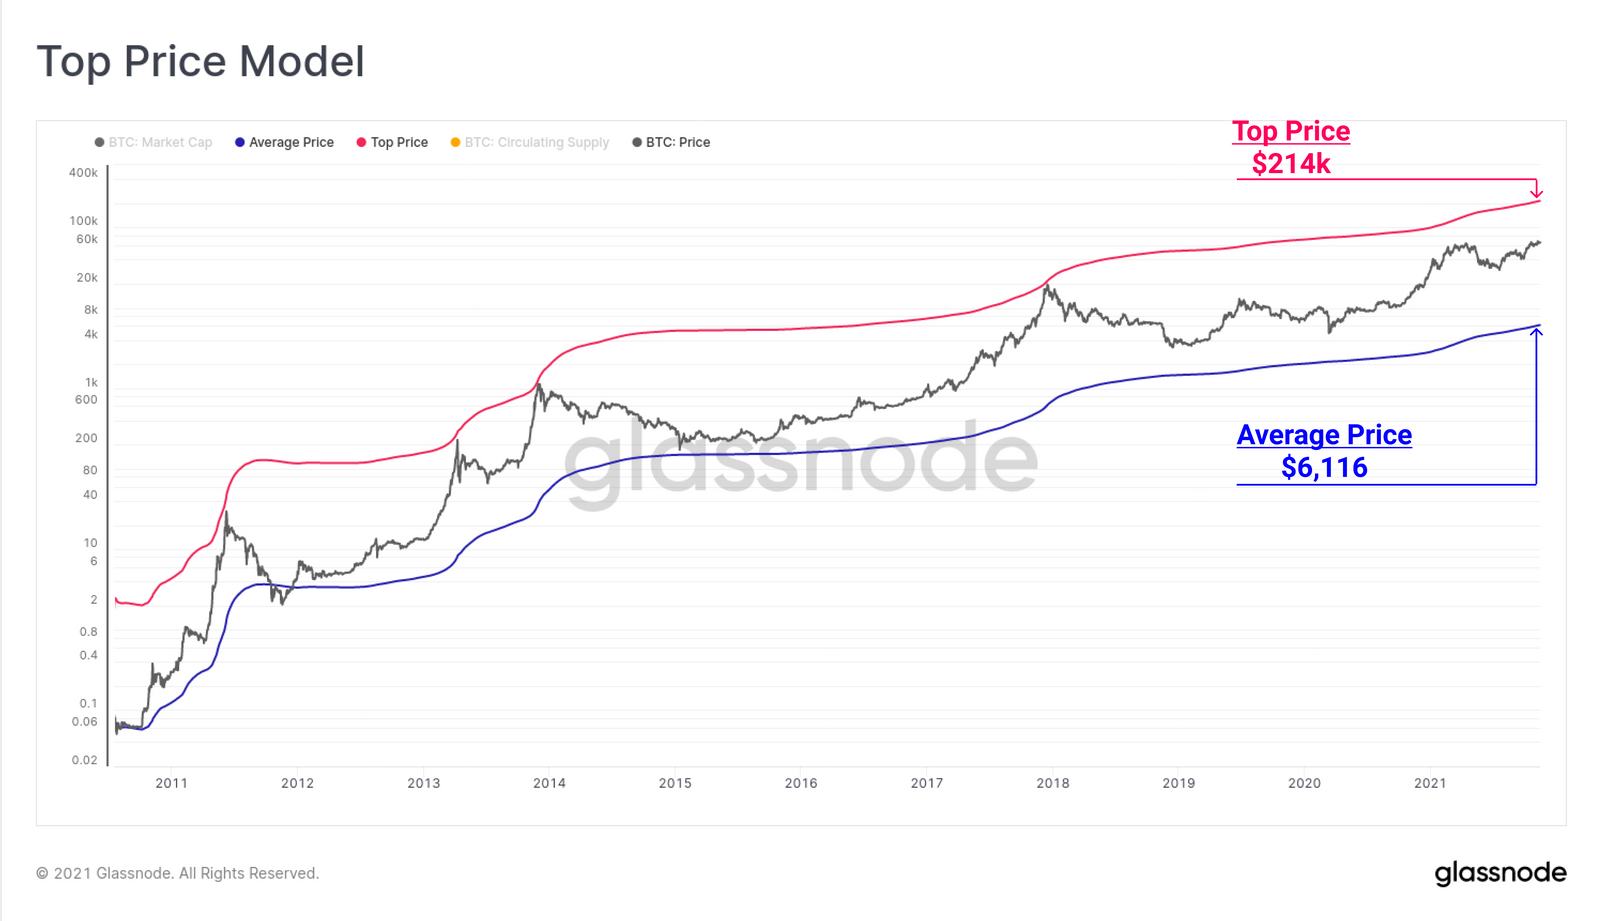
Furthermore, the Top Price model seemed to be giving a current cycle top value of $214k. Here, it’s notable that the all-time average price is much slower to change than the 200DMA and thus, the Top Price will be a less volatile top model.

Source: Glassnode
As highlighted in a previous article, the median Bitcoin price target for 8 December remains $84k, as per Ecoinometrics. Thus, seems like $69k is still far from a market top.
If that is the case, what about do the recent market corrections imply?
Market yet to be overheated
Bitcoin’s 30-day MVRV ratio had a reading of -3.5, at press time, suggesting that the average profit of all addresses that have acquired BTC over the past month was -3.5. In hindsight, it’s notable that Bitcoin’s 30-day MVRV ratio was +7.18%% just a week ago.
Interestingly, while the short-term MVRV ratio showed potential for price recovery, it might still justify further downward volatility before the opportunity zone is reached. This can be inferred based on data from Santiment.
Finally, the NVT model flashed a green bar on the day, suggesting that Bitcoin’s market capitalization is too low relative to the amount of unique BTC moving on the blockchain. However, if Bitcoin’s network-level activity can hold its own in the days to come, despite downward price pressure, it may be a hopeful sign of quick recovery.
It seems like for now, the best option would be to sit tight and HODL or do your own research about potential buy/sell zones.


