Bitcoin has been seeing some ‘unusual activity’ and this is what it means

Oh boy, Bitcoin. Short-term sellers would be panicking over the sight of its immediate price action as the asset has been on course for a massive swing action between $64,500 and $60,380 over the last 48 hours. At the moment, the tide is swinging towards the bears, but there might be something the larger market has missed. Something that may give us a better idea of what to expect from the immediate market trend.
Is Bitcoin being unusual on the hourly?
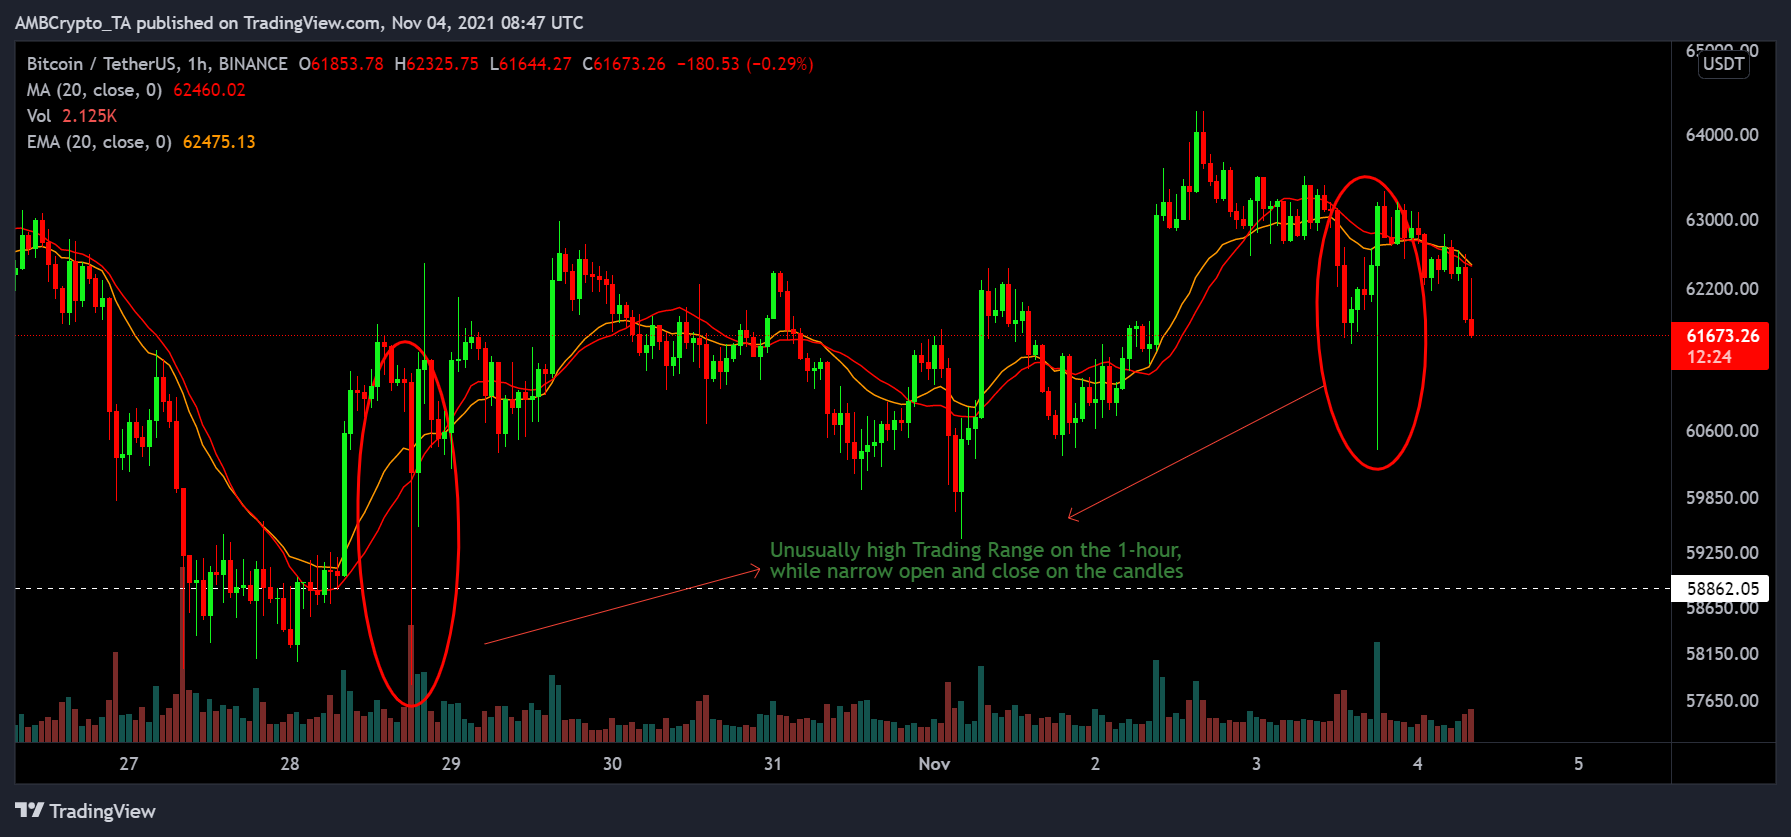
While consistent decline and steady recovery are often attached to BTC’s market rapport, over the past week, a couple of incidences should be up for discussion.
On 28 October at 18:00 UTC and 3 November at 18:00 UTC, BTC opened a long trading range on the hourly candle. They were massive swing trades of 5.59% and 4.46%, respectively, but the open and close values for the candles were narrow, recording a change of only 1.65% and 1.09%, respectively, after candle close.
This is highly unusual for Bitcoin since BTC is usually resistant to such a cascade in value due to higher market liquidity. Altcoins face this on a regular basis but for Bitcoin, this might be a sign of catastrophe.
Common Criminals?
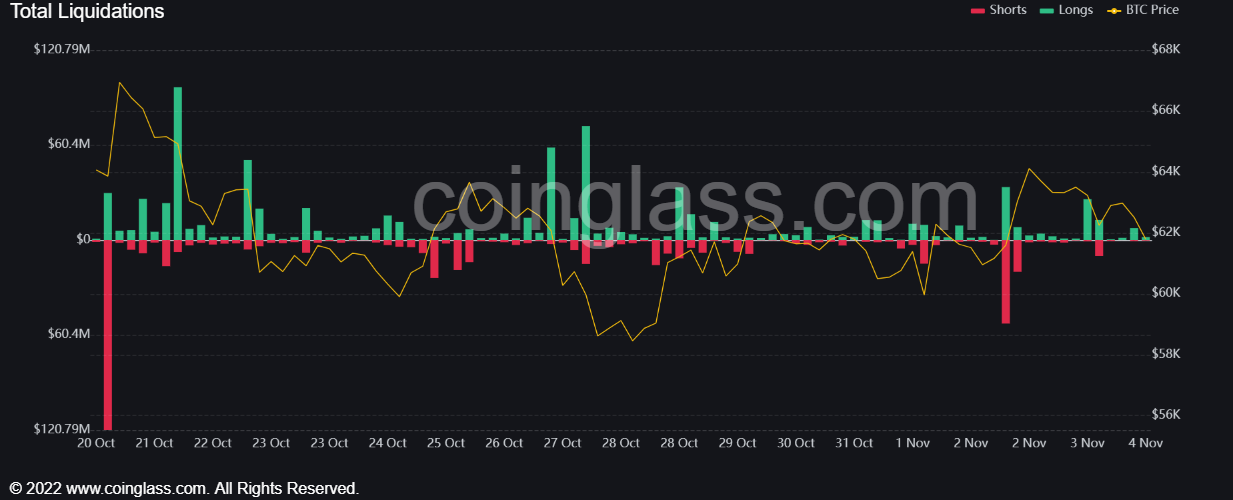
From a logical point of view, we analyzed liquidation data to analyze if Futures contracts led to a wide trading range. Data suggested that liquidations were not extremely chaotic, with only $12 million shorts undergoing liquidations. The funding rate also avoided a major reset on the chart, meaning that Futures did not trigger the discussed price action.
However, when it comes to liquidity pools, it might be a different story. As illustrated in the chart below, a cluster of buy orders for perpetual contracts was observed around the range of $60,000 – $60,500 in the short term. And, this was recorded before the price drop.
While it cannot be confirmed, price action does follow liquidity pools, and it has been well-documented in the past.

Source: Kingfisher.io
November Blues?
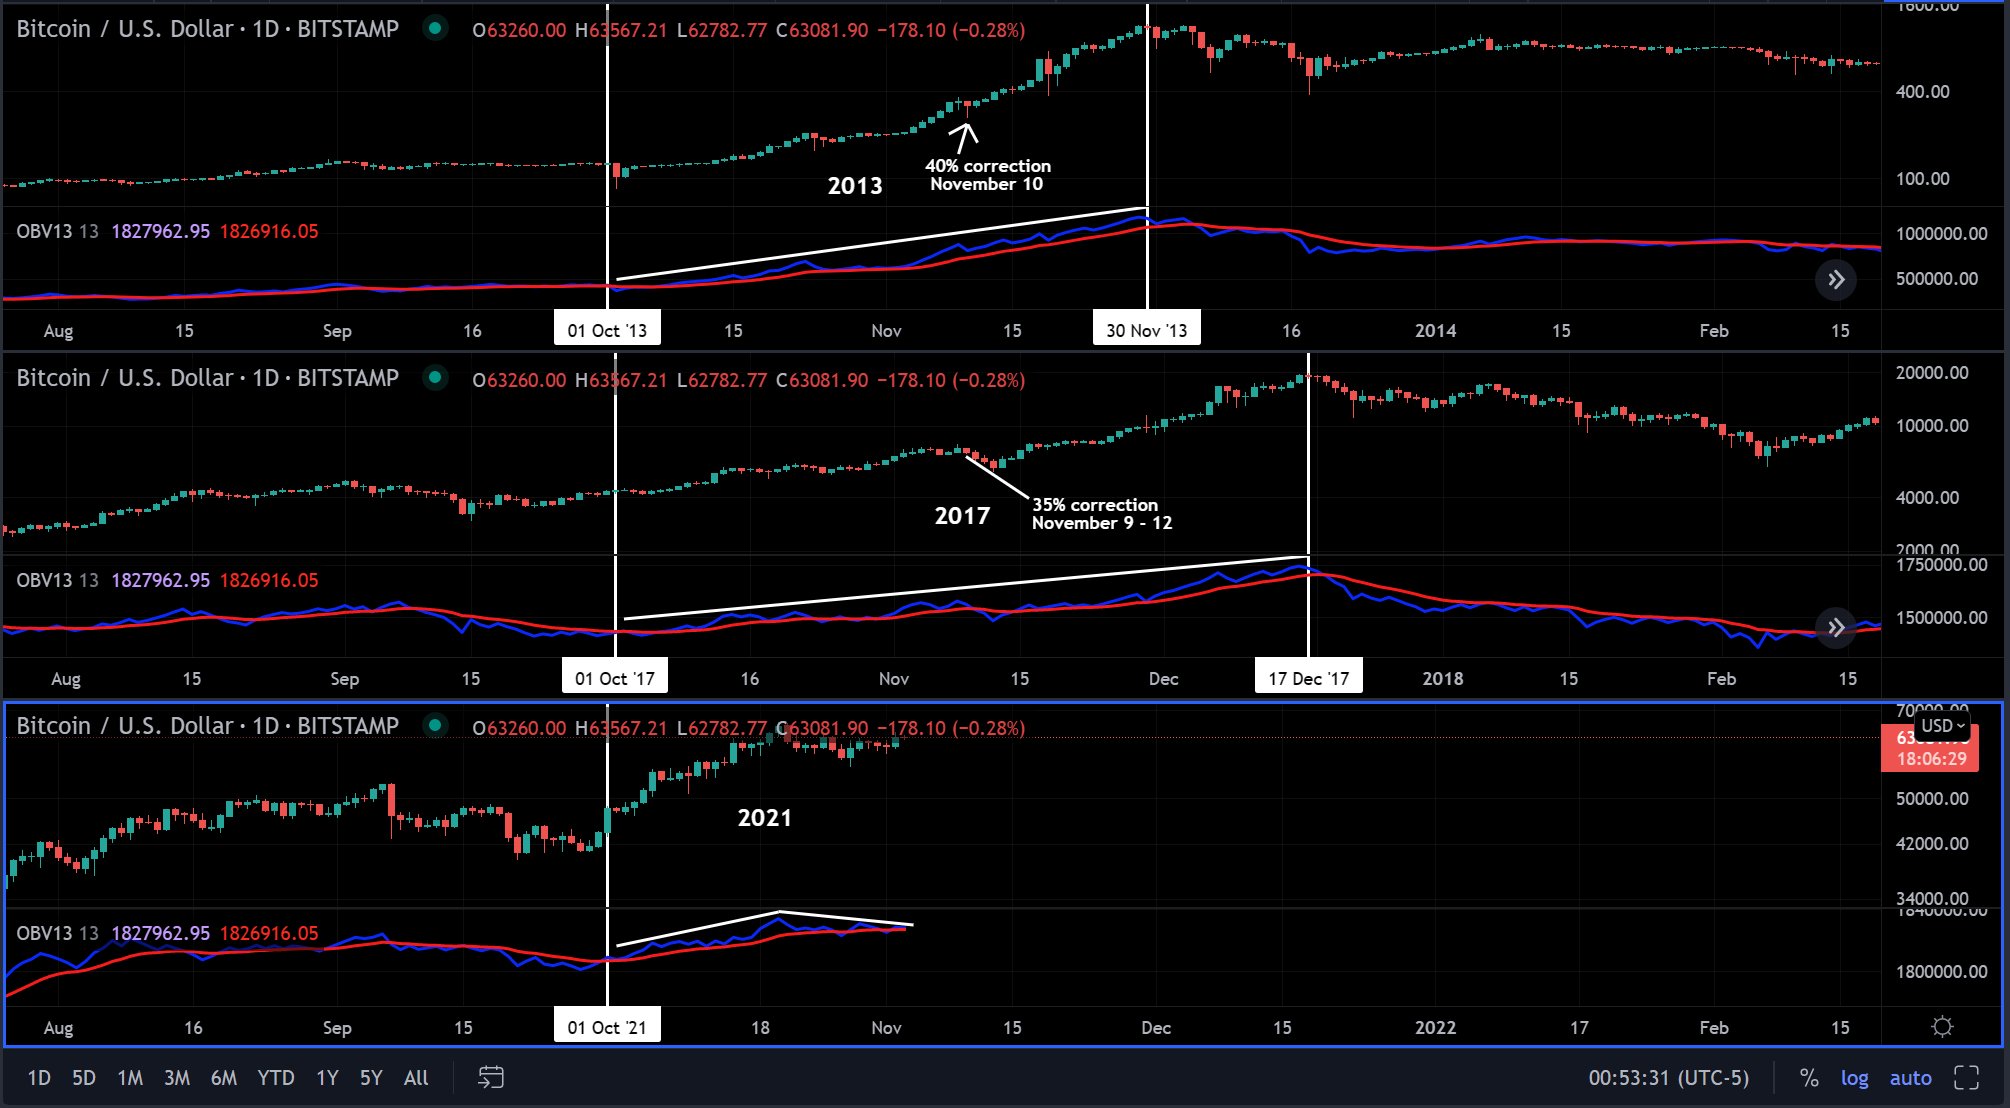
While it will take a major blowout for Bitcoin to point to a long-term trend reversal, the recent hourly candle blowout may be a sign of an impending historical correction. During both the bull runs in 2013 and 2017, November actually marked 40% and 35% corrections, respectively, from the immediate top.
Right now, a 40% and 35% drop will mean a re-test down to $43,000 and $39,000. The possibility of such a turnaround within the next 3 weeks is extremely low, but an immediate drop down to $55,000 – $58,000 might be pending for Bitcoin.
The first sign of caution has now been observed twice on the 1-hour chart. Ergo, tracking Bitcoin’s value closely will be extremely critical over the next two weeks.


