Bitcoin: How close are we to the top?

Bitcoin is currently closing down on 6-straight days of price appreciation in the daily chart. The last time BTC saw 6-green candles was back towards the last week of December 2020. While this could be a key sign of an upcoming bullish period for Bitcoin, all the metrics were not completely sold on the fact yet.
In this article, we identify why Bitcoin could still be in a consolidation phase, which in turn, has long-term positive credentials as well.
Bitcoin accumulation & N0n-Aggresive Netflow
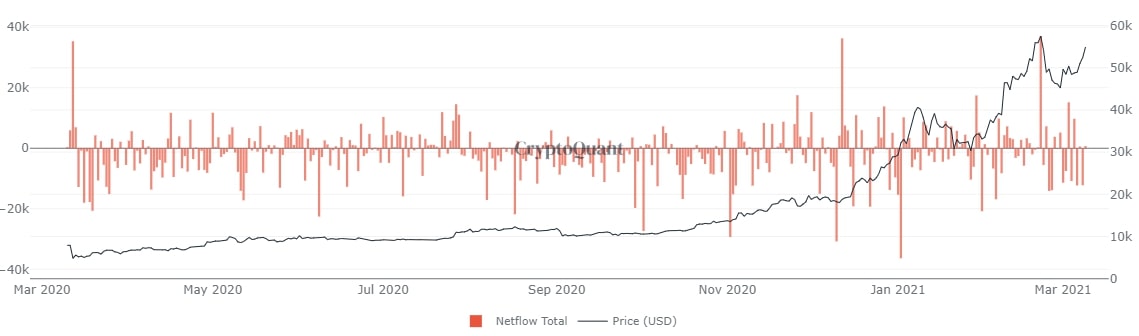
Without taking anything away from Bitcoin in terms of momentum, it is important to note the total exchange net flows are not aggressively one-sided at the moment. During the rally in January and February, exchange outflows dominated inflows whereas it was much more balanced at press time.
There is a cyclicity, that can be observed as well.
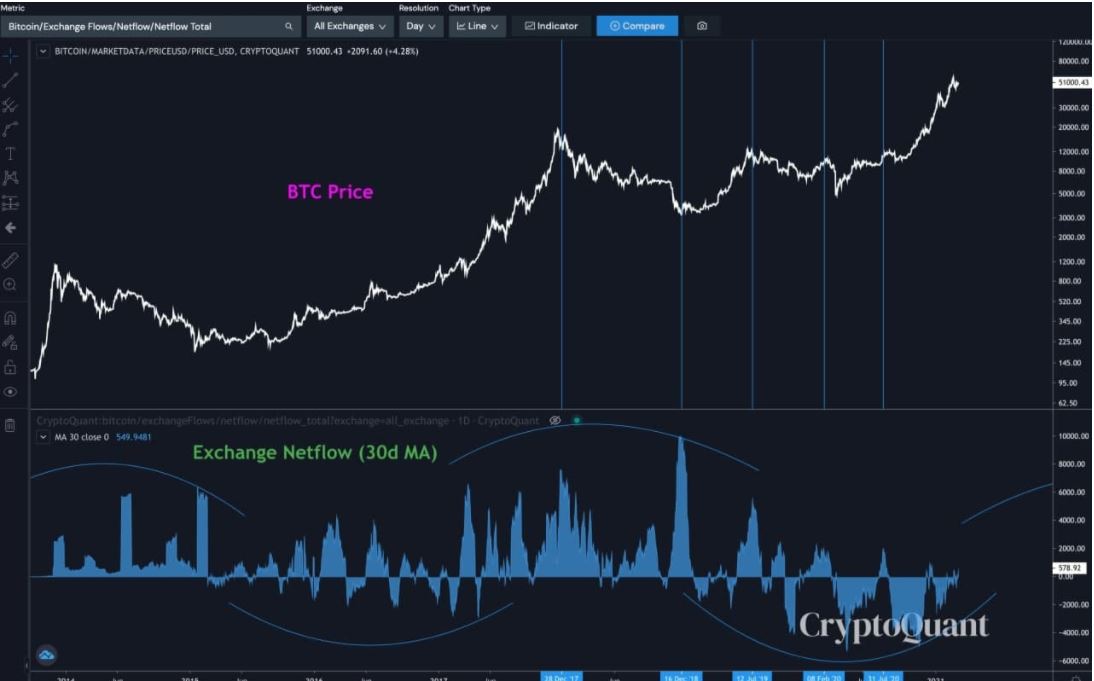
On Analyzing the above chart, we can see that the market could be reaching a peak in net flows, which may indicate a potential reversal in the current cycle. In fairness, the chart can be estimated in both bullish and bearish perspectives but the benefit of the doubt would need to go toward a bullish outcome.
One other reason is also the fact that over the past few months, net flows have been negative which means a global top hasn’t been achieved yet, which could be the case for the possible cycle.
How close are we to the top?
It is difficult to estimate since multiple assets remain a little bearish. According to Santiment, the weighted social sentiment index for Bitcoin is still negative, exhibiting that the overall narrative is still reeling from the February drawdowns.

However, Skew recently reported that Bitcoin is more volatile than Ethereum, in terms of 1-month realized volatility spread, which is rare in itself.
Additionally, another neutral sentiment was also observed by the current Coin-Days Destroyed Chart for BTC.
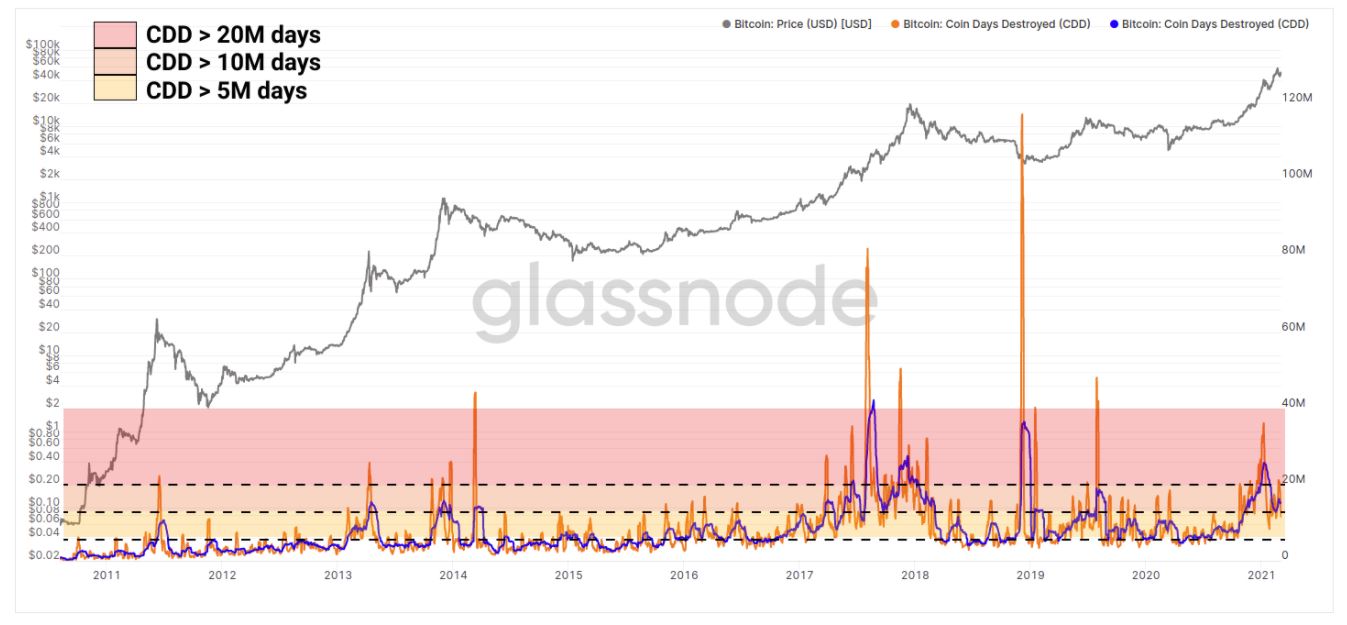
A higher CDD value is synonymous with a rising bull rally in the chart and currently, CDD is moderate to low, which is noticeable with day-to-day traffic.
At press time, Bitcoin was breaking above $56,000, so the rally may undergo an upswing over the next few hours, but the overall trend is still neutral, so another drop is also likely.