
Ethereum whales make massive moves: Is this your cue to buy ETH?

Bitcoin, at press time, was valued at around $64,000. So close to its ATH, it seems almost futile to project possible corrections. However, while a majority of the community is expecting a $70k summit in the next few days, the likelihood of a correction is strangely still intact.
Without committing the cardinal sin of revolting against Bitcoin’s rally, there are a few factors that have played a role in BTC’s trend direction in the past. And, it is worth keeping them in mind during the current market situation.
Will Bitcoin follow the liquidity pools again?

Source: jarvslabs
Although Bitcoin is oscillating around its all-time high range, it is important to note that there is more liquidity under the price point of $62,000. In the past, we have identified Bitcoin follows these liquidity pools since during periods of high price action, the asset tends to follow the capital.
Right now, because more liquidity is present under the price range of $62,000, the price may approach these values over time as traders look to add more margin or liquidate their positions.
With the price moving sideways, these pools can become more important going forward.
Supply-Demand is heavily favoring BTC
Source: jarvslabs
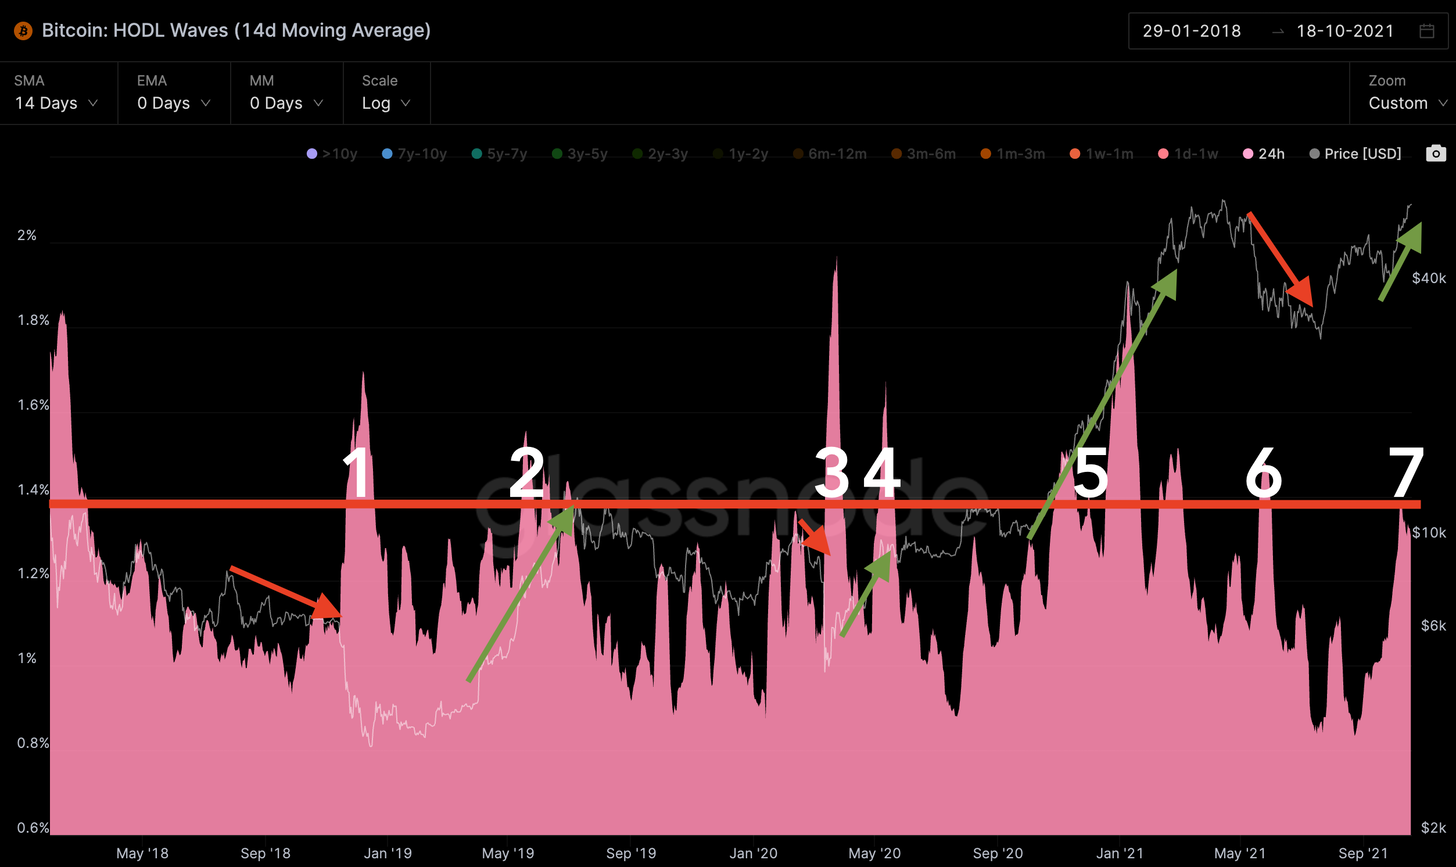
This is where the narrative of no man’s land comes into the picture for Bitcoin. According to data, the 24-hour HODL rate has been jumping for Bitcoin, alongside its rising price. If the price is trending up and the 24-hour HODL rate jumps, it is an indication of a sustained rise in demand from spot buying.
This is where Bitcoin’s price movement becomes trickier since the MVRV suggested the possibility of profit-taking for investors.
In our previous articles, we have mentioned that a higher MVRV opens up the narrative of traders taking some profits out. However, at press time, there wasn’t any hint of excessive selling pressure.
When, How, and Where?
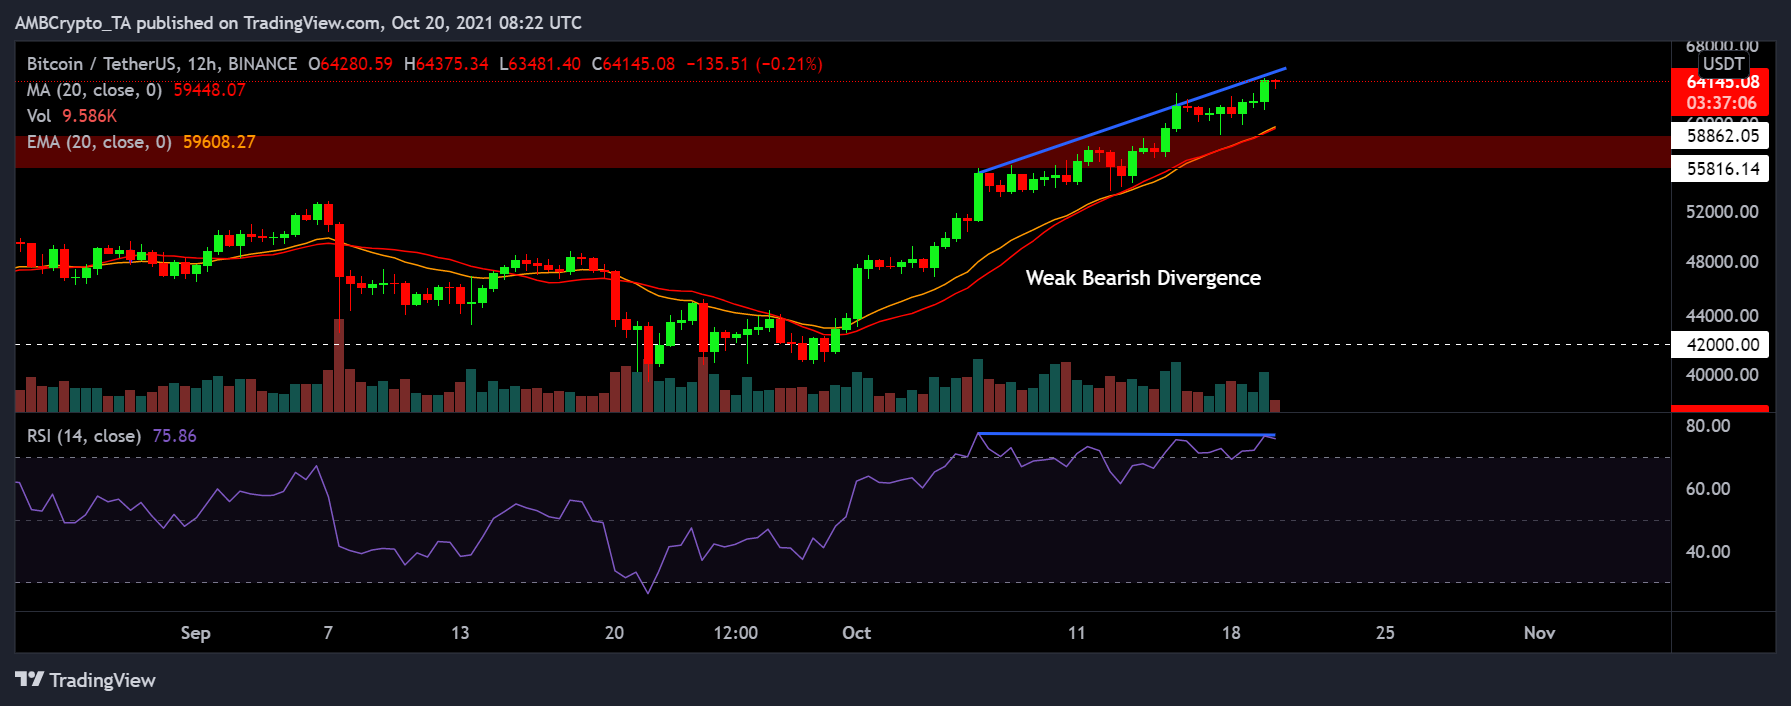
Source: Trading View
Now, from a purely market structure point of view, there is a lack of bullish divergence for Bitcoin at the moment. But, a weak bearish divergence can be observed on the 12-hour chart.
With the Relative Strength Index or RSI tapering off on the chart and the price appearing to rise, a pullback down to $60,000 is not beyond immediate occurrence.
Hence, irrespective of its high trading range, Bitcoin’s price may still undergo corrections.


