Bitcoin, Polkadot, MATIC Price Analysis: 29 June

The cryptocurrency market’s price movement over the last few days, despite recoveries, has been quite repetitive. Owing to the same, most altcoins have been trying to break past their immediate resistance levels.
Bitcoin, for example, hiked marginally by 0.7% over the last 24 hours. What’s more, while quite a few altcoins registered buy-momentum on the charts, others like MATIC struggled to make new highs.
Bitcoin [BTC]
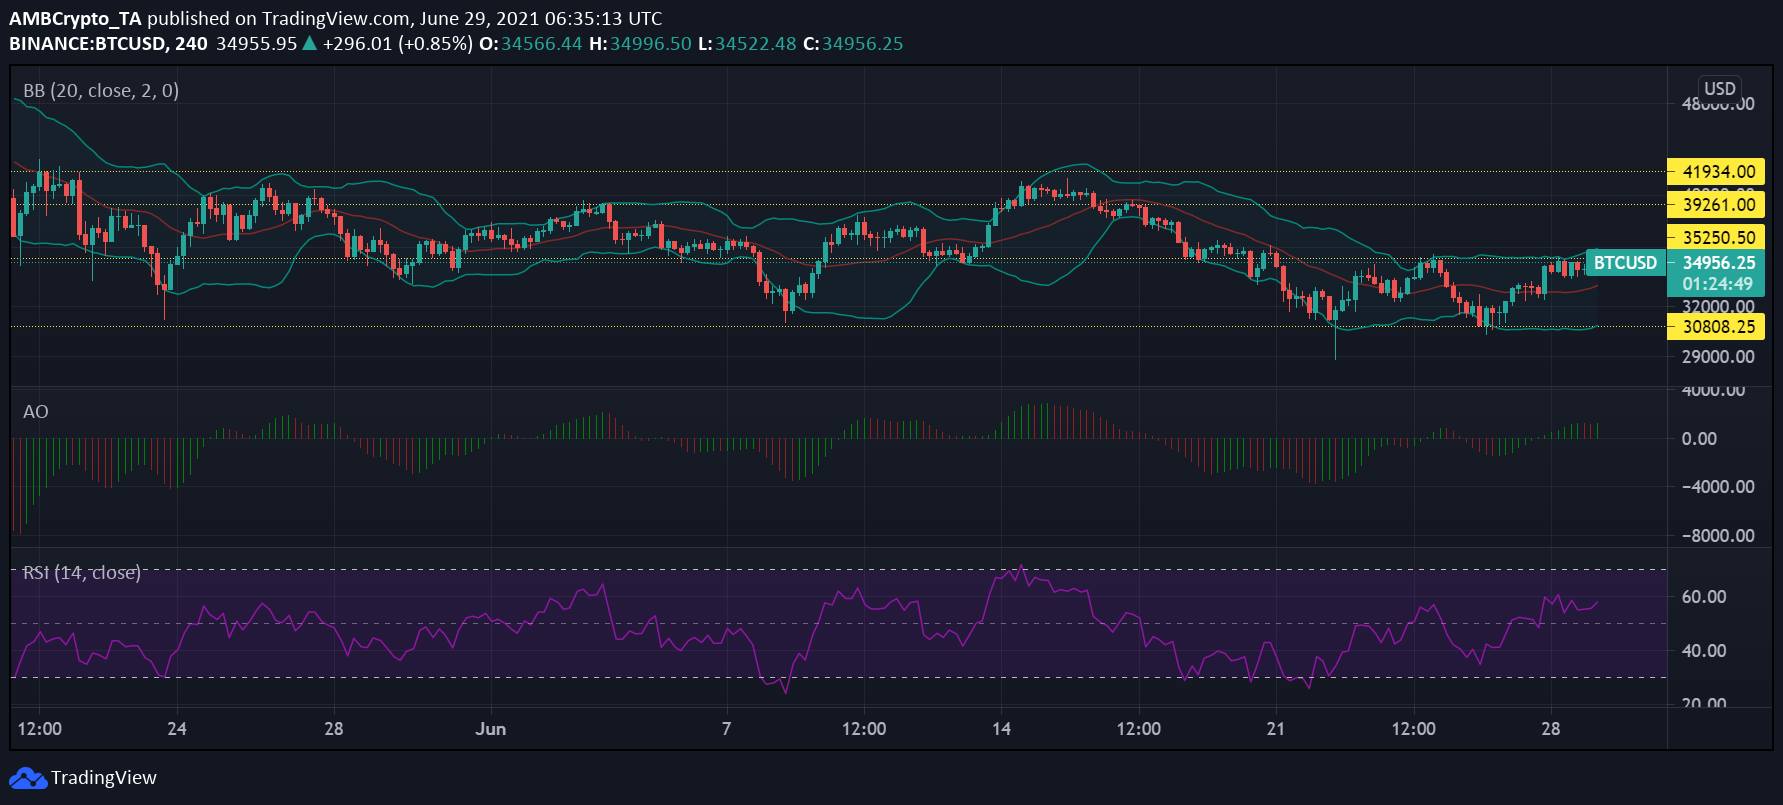
Bitcoin’s price movement has been range-bound for the last couple of days, with BTC in the green at press time. In fact, the cryptocurrency was mostly moving between the $30,800 support and $34,000 resistance level after 21 June, until it pushed past the latter over the last 24 hours.
With respect to price volatility, the Bollinger Bands for the asset suggested that the coin would display restricted price movement. The Relative Strength Index was above the neutral zone and it observed a tiny uptick – A finding that meant that buying pressure was greater than selling pressure, at the time of writing.
The Awesome Oscillator gave off mixed signals as red signal bars were found intermittently among the dominant green bars. This reading signified that despite a couple of bearish trading sessions, the coin might be heading towards recovery.
Polkadot [DOT]
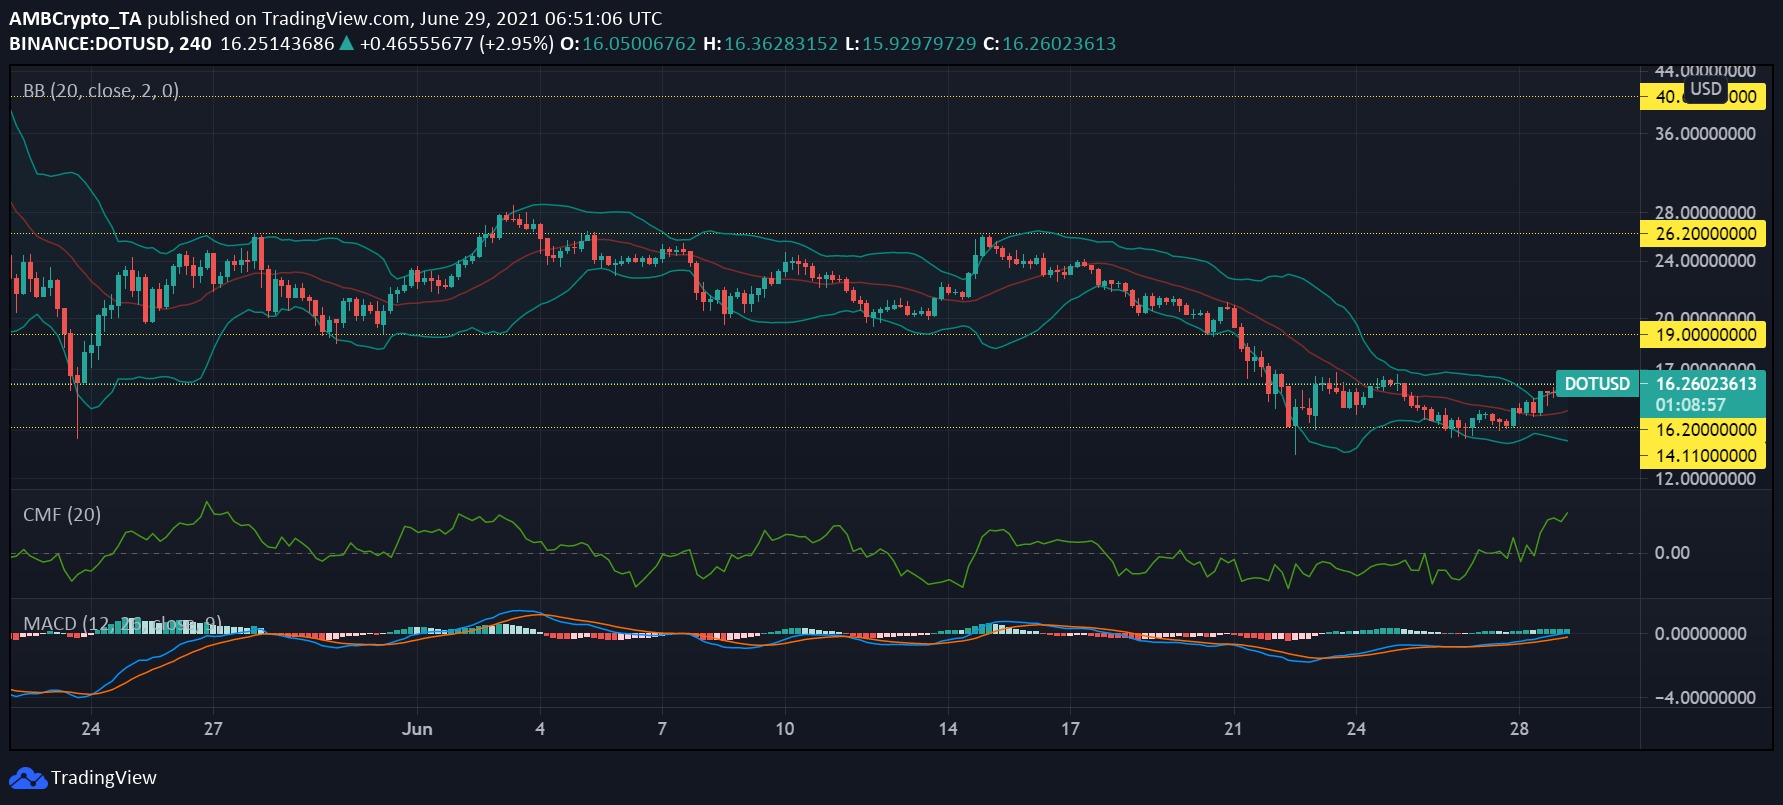
DOT‘s charts projected a bullish outlook after it successfully defended the $16.20-level for the last 72 hours. After DOT fell to the $14 support level, its recovery has been slow but consistent.
The MACD’s histogram validated this uptrend of the coin as the indicator highlighted the buildup of bullish momentum, at press time. Capital inflows for the coin were on the rise as the Chaikin Money Flow registered an uptick, along with being far away from the neutral zone.
Further, the Bollinger Bands indicated divergence at the time of writing, affirming that the coin’s prices could be on the rise. In case the coin renews its uptrend in earnest, the next likely resistance for the coin would be $19.00
MATIC
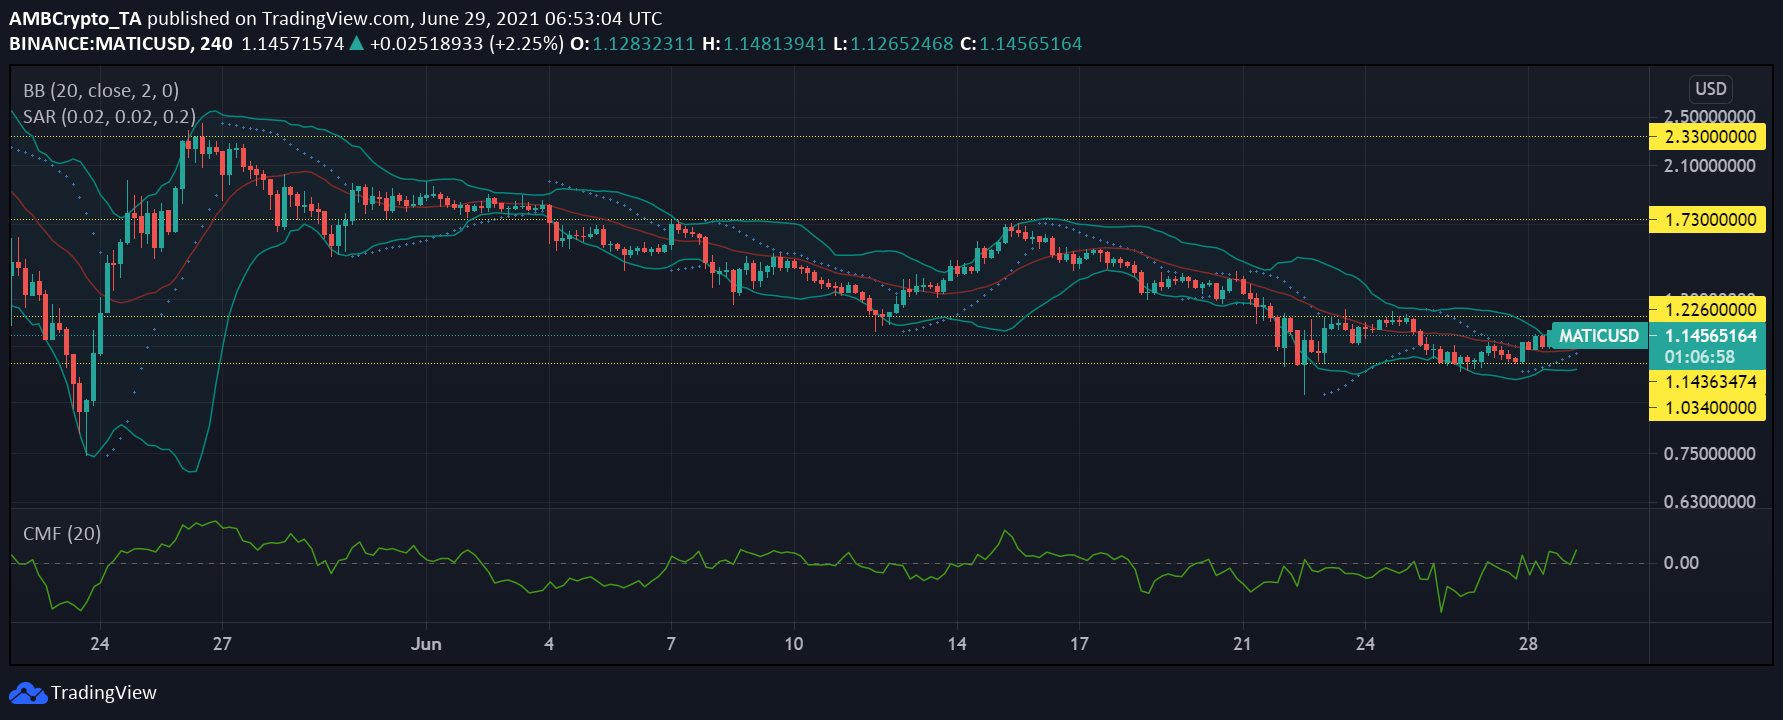
MATIC’s prices have not closed outside the range of the $1.03 support and $1.22 resistance level for the past week. In fact, MATIC had been struggling to break past the $1.15 resistance level. However, at press time, the coin was valued at just under $1.15 and if the crypto hikes again, the next resistance would be at $1.22.
MATIC’s recovery has not been substantial, however, with the same underlined by the Bollinger Bands closing in somewhat at the time of writing. Capital inflows did note an uptick though, as per the Chaikin Money Flow.
Finally, the dotted lines of the Parabolic SAR were spotted below the candlesticks and highlighted a price uptrend for the alt.


