
Ethena crypto price prediction – Can ENA breach $1 without whale support?

Disclaimer: The findings of the following analysis are the sole opinions of the writer and should not be taken as investment advice
In the short-term, Bitcoin flipped the $47,400-level from resistance to support. Bitcoin’s dominance has also been on a steady downtrend over the past few days, with the world’s largest cryptocurrency holding its own above the $45,000-mark, a sign that capital was flowing out of altcoins and into Bitcoin.
In fact, there were some signs that a bullish bias was back in the market as the correlation with the S&P 500 picked up too.
Bitcoin 1-hour chart
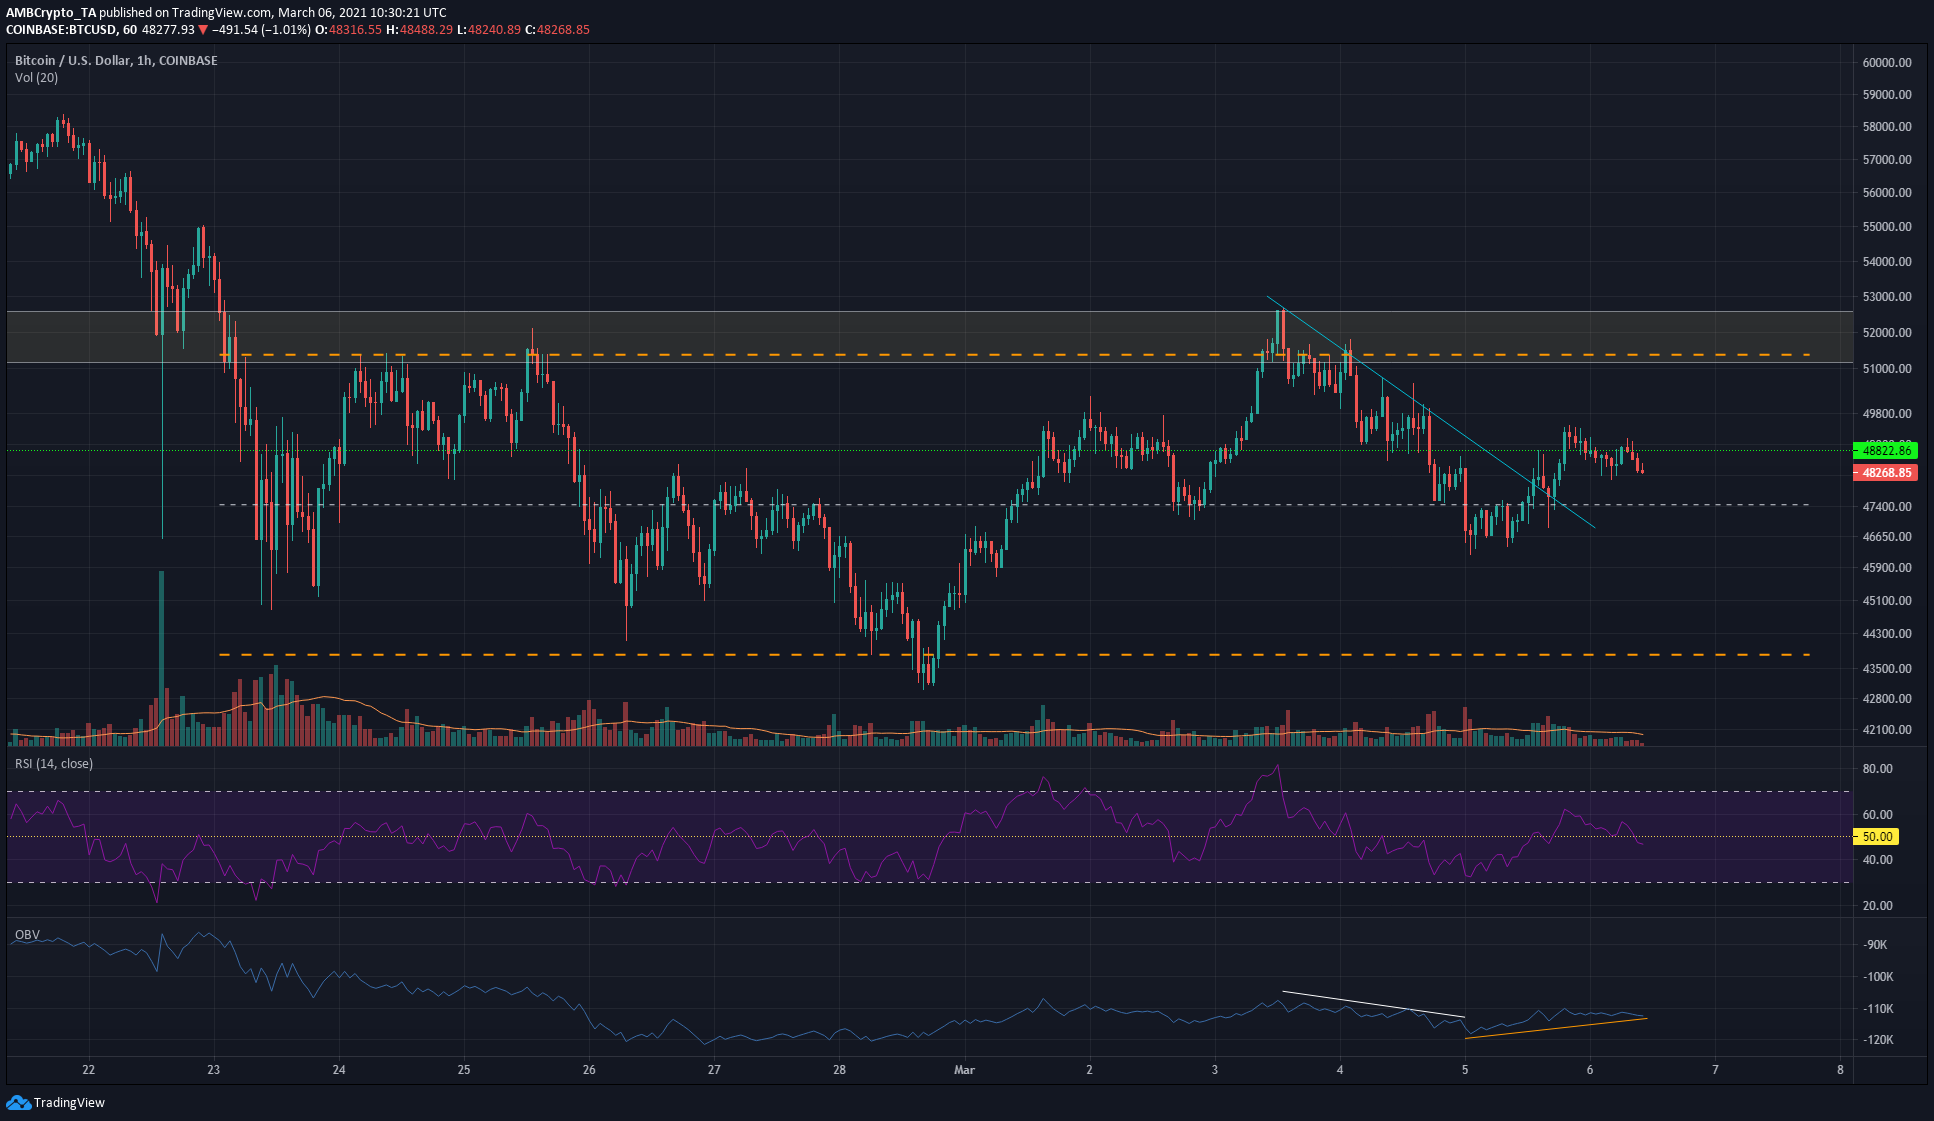
Source: BTC/USD on TradingView
The past two weeks have seen BTC trade within the range of $43,810 to $51,370. The mid-point of this range at $47,430 has been an important level of support and resistance over the same time period.
The descending trendline (cyan) was tested once more, and the bulls achieved a breakout as high as $49,400. However, there was some selling there that saw BTC pushed back lower to trade at $48,268, at the time of writing.
A move above $47,400 is an encouraging sign and another attempt to breach the $48,800-$49,350 area of supply is likely to be seen in the short-term.
Reasoning
On the hourly chart, the RSI was oscillating around the 50-mark, with market momentum not in favor of either side yet. The price dip from $49,350 over the past 12 hours was backed by low trading volume, indicating that it could be reversed.
The market’s bears were halted at $46,600 before a move above the trendline (cyan) was seen. Since then, the OBV has been making a series of higher lows to show that buying volume was rising. However, by and large, the OBV was pretty much in the same area it was before showing that short-term volatility notwithstanding, March has seen a deadlock between buyers and sellers.
A retest of $47,400 cannot be ruled out, but it is likely that this level will hold as support if tested. To the upside, a move beyond the aforementioned region of supply will likely see BTC test the $50,000-mark.
Conclusion
A retest of $47,400 or a hike above $49,350 can be an opportunity to enter a long position with a target of $52,000, based on the evidence at hand. Weekend volatility could also rear its head, making risk management all the more important.


