Bitcoin Price Analysis: 11 April

Is the top in for Bitcoin? Unlikely. Multiple on-chain metrics showed that, although strongly bullish, this was not the top for Bitcoin. Funding rates are high but the market is not driven solely by derivatives. The spot volume has been high as well and so the market is not yet at the point where the rally is solely driven by derivatives. The overcrowded long trade could even see a burst to $64,000, although some pullback could be seen before another wave to $68,000.
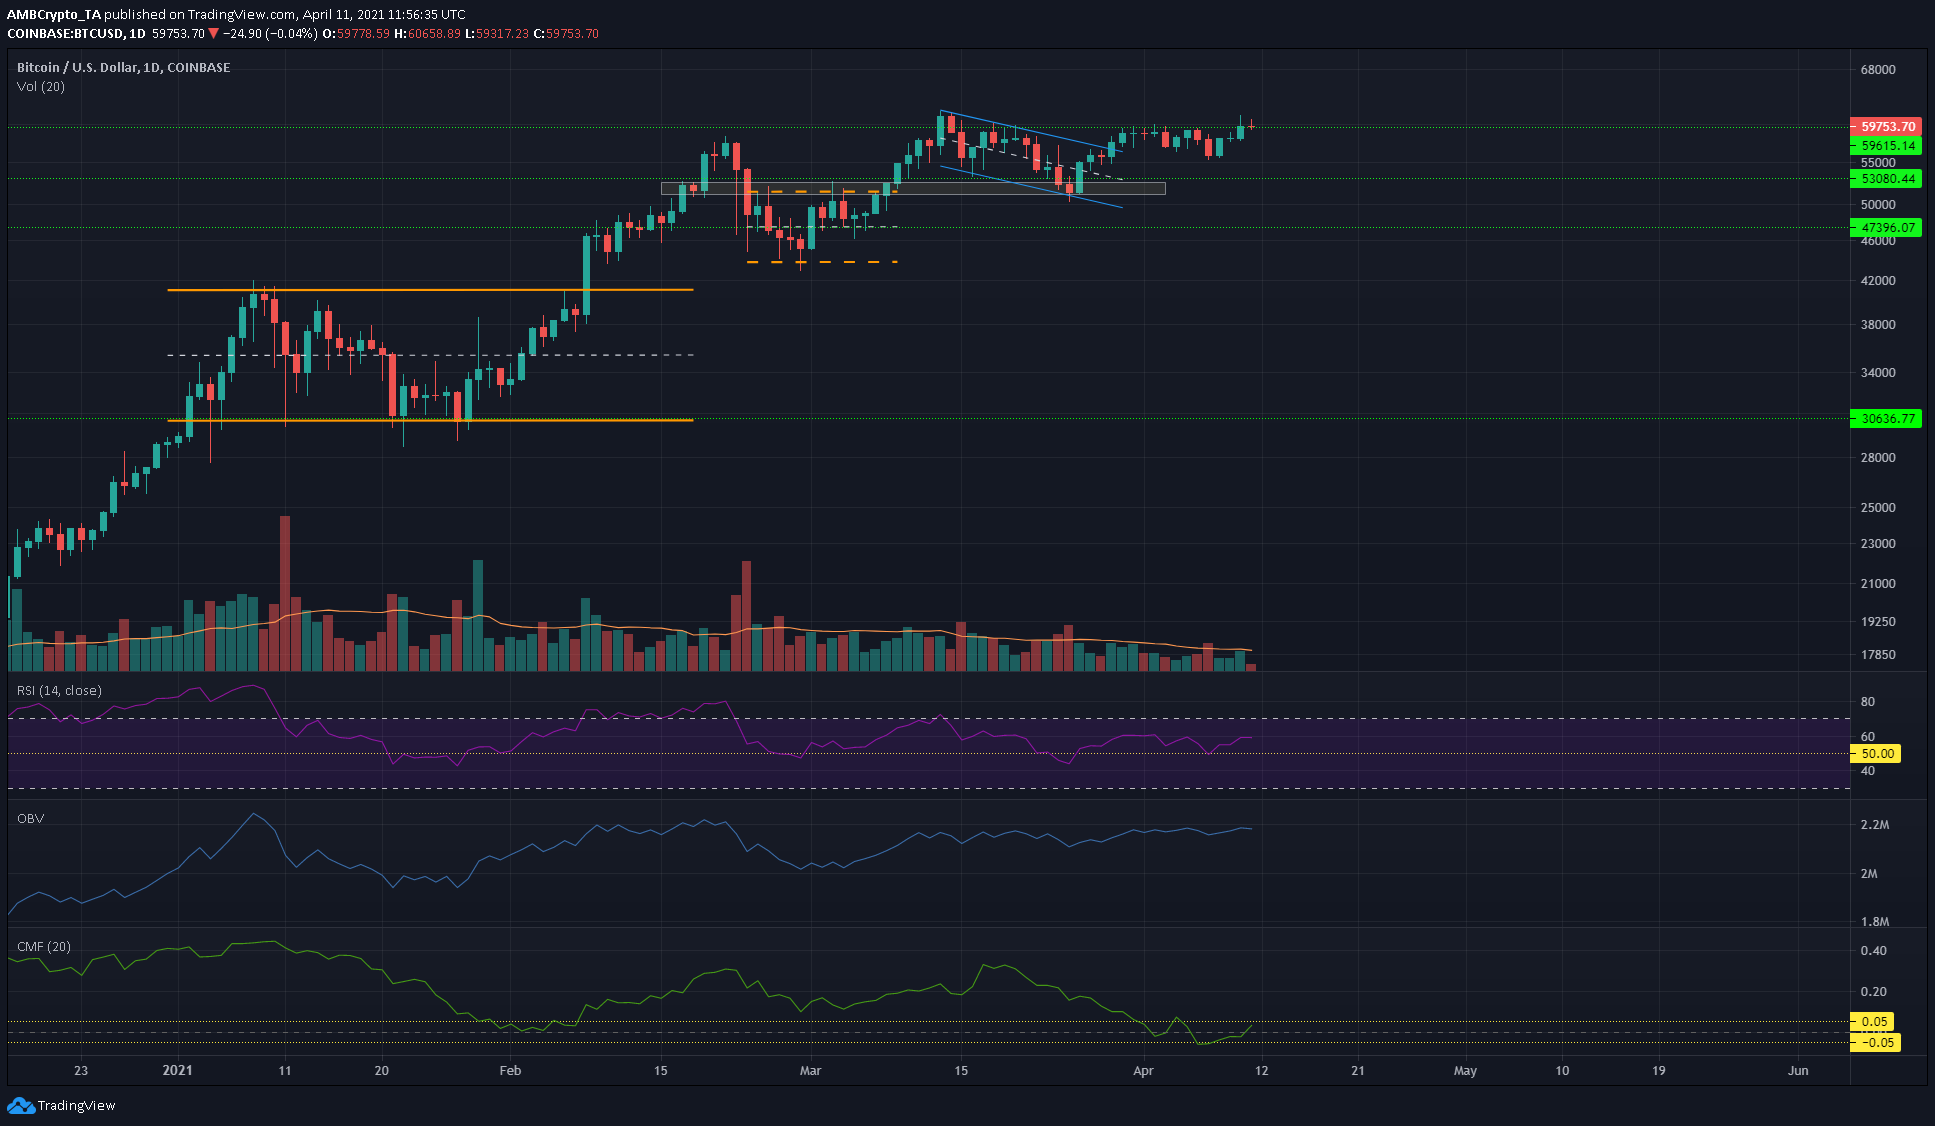
Bitcoin 1-day chart

Source: BTC/USD on TradingView
The charts showed BTC break out of a descending channel to climb back to $61,000 over the weekend, and at the time of writing was trading at $59,750. Not shown on the chart, but an ascending triangle pattern was emerging, with the base at $53,000 and a higher low at $55,900, while the resistance at $60,000 has held over the past few days. This could see a move to $67,000-$68,000 in the next week or two.
However, there is sure to be a liquidity hunt to the downside before a breakout – and the funding rate could get exorbitant quickly as everybody tried to long a breakout past ATH. Hence, the $58,000 and $55,600 are strong support levels should a dip occur. A demand zone at $53,000 has also been established.
Rationale
The RSI was forming higher lows, showing that bullish momentum was weakening. The OBV has also been relatively flat in recent days and has not yet climbed above the highs seen in mid-February even though the price has formed a higher high.
Trading volume has also been trending lower, showing consolidation was in progress.
The Chaikin Money Flow was moving in the neutral area for nearly 10 days now – something that last happened on the daily chart in May 2020, when Bitcoin consolidated at the $9400 area.
Conclusion
Jumping in on a long position upon breakout past $60,000-$61,000 could result in losses. Rather, a pullback to $58,000 or even deeper to $56,600 can be used to scale into long positions. Bitcoin Dominance is also falling, and large-cap coins are performing strongly, showing that capital is flowing from BTC to large-cap coins, that is, coins with more than a $2 billion market cap.


